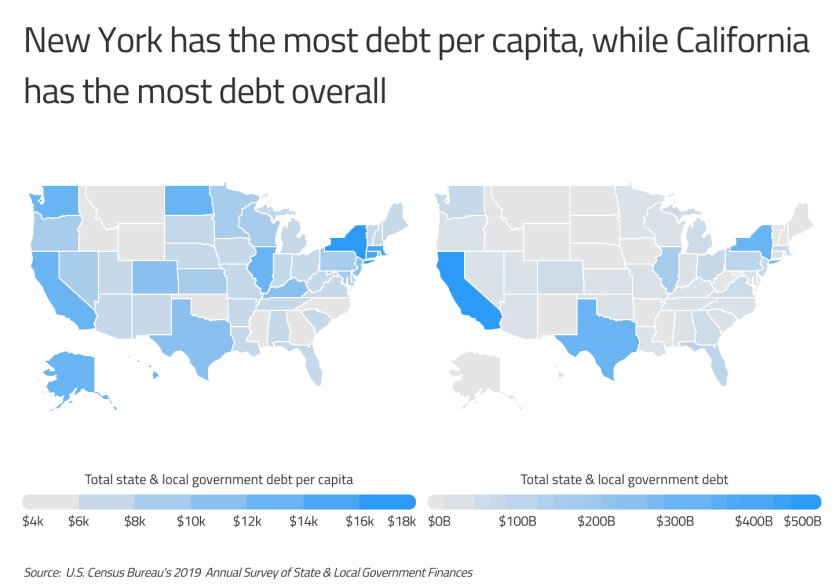
According to data from the U.S. Census Bureau, total state and local government debt was $3.17 trillion in 2019 or about $9,700 per person. State governments use debt to finance education, infrastructure and to cover budget gaps, among other things. State and local government debt can fluctuate due to spending habits or changes in income from taxes and other sources, such as during recessions.
In the 1940s and 1950s, state and local government debt was much lower than today. Federal, state, and local governments grew substantially during the 20th century. Spending, revenue, and debt increased as the population grew, and the government invested more in infrastructure, education, and social programs. Leading up to the Great Recession that began at the end of 2007, total state and local government debt increased sharply. It has been falling since 2010 but increased between 2019 and 2020. In the wake of the pandemic, the coming years will likely see a continuation of this trend. States with rising debt may raise taxes or cut spending to help bring their budgets under control.

The amount of state and local government debt depends heavily on the population of the state, the amount of state employee retirement benefits, the size of social programs, and tax revenue. As a result, states vary widely in their amounts of debt on both a total and per capita basis. While New York leads the country in terms of per capita government debt, at $18,411 per person, California, the most populous state, has the largest amount of total debt, at $507 billion. Conversely, Wyoming has both the lowest amount of total and per capita debt, at about $2 billion or $3,437 per person.

The states with the most state and local government debt per capita are spread across the country, including both very populous states such as California and Texas as well as sparsely populated Alaska. With over $18,000 in state and local government debt per resident, New York ranks first in per capita debt. Local debt in New York is over $50 billion more than state government debt, due in large part to high amounts of school district debt.
Nationally, state and local government debt totals $3.17 trillion, with local government debt making up 63 percent of the total. The state and local debt to state GDP ratio shows how much a state owes compared to how much it produces. States with less debt as a percentage of state GDP are in a better position to repay their debts. As a percentage of state GDP, state and local government debt ranges from a low of 4.9 percent in Wyoming to a high of 24.7 percent in Kentucky.
| State | Rank | Total SLG debt per capita | Total SLG debt | Total state gov debt | Total local gov debt | Total SLG debt % of GDP |
N.Y. | 1 | $18,411 | $358,150,378,000 | $150,744,533,000 | $207,405,857,000 | 20.2% |
Conn. | 2 | $15,037 | $53,612,594,000 | $41,822,350,000 | $11,790,243,000 | 18.6% |
Mass. | 3 | $14,263 | $98,310,530,000 | $78,663,118,000 | $19,647,413,000 | 16.5% |
Ill. | 4 | $13,029 | $165,097,105,000 | $65,272,156,000 | $99,824,941,000 | 18.6% |
Alaska | 5 | $12,994 | $9,505,582,000 | $6,060,930,000 | $3,444,652,000 | 17.5% |
Calif. | 6 | $12,823 | $506,660,567,000 | $145,292,660,000 | $361,367,923,000 | 16.2% |
N.D. | 7 | $12,725 | $9,697,010,000 | $3,375,270,000 | $6,321,740,000 | 17.0% |
Hawaii | 8 | $12,512 | $17,715,106,000 | $10,001,827,000 | $7,713,279,000 | 18.5% |
Wash. | 9 | $12,416 | $94,548,994,000 | $35,584,686,000 | $58,964,310,000 | 15.4% |
Kentucky | 10 | $11,885 | $53,097,229,000 | $15,346,875,000 | $37,750,353,000 | 24.7% |
R.I. | 11 | $11,283 | $11,952,946,000 | $9,275,273,000 | $2,677,673,000 | 19.3% |
Colo. | 12 | $11,105 | $63,953,107,000 | $19,241,118,000 | $44,711,988,000 | 16.3% |
Texas | 13 | $10,410 | $301,840,025,000 | $53,794,342,000 | $248,045,679,000 | 16.4% |
N.J. | 14 | $10,384 | $92,231,421,000 | $63,926,685,000 | $28,304,736,000 | 14.5% |
Penn. | 15 | $9,778 | $125,178,460,000 | $48,958,884,000 | $76,219,576,000 | 15.5% |
U.S. | - | $9,659 | $3,170,325,344,000 | $1,174,375,272,000 | $1,995,950,070,000 | 15.0% |
This report was first published by Commodity.com. Read the original article here.


