New data published by the New York City Department of Transportation adds to a growing body of evidence about which interventions most effectively reduce traffic deaths and serious injuries.
The study evaluated data on crashes, injuries and fatalities on certain corridors in New York before and after various street improvement projects were completed. The New York City DOT completed more than 1,000 such projects between 2010 and 2021, according to the report. They include changes ranging from the relatively simple — like leading pedestrian intervals, which give pedestrians a head start on green lights — to more complex redesigns, like road diets, which involve removing a lane of vehicle traffic for a bike lane or another purpose. The department used data from 2005 to 2018 to look at average yearly serious injuries and deaths before and after the improvements were completed, with some variation in the sample size for various treatments.
The data show substantial reductions in serious injuries and fatalities for all roadway users resulting from street improvement projects like road diets, pedestrian islands, curb and sidewalk extensions, and leading pedestrian intervals — all on the order of 30 percent or more. Other interventions, like turn calming and painted and protected bike lanes, had smaller but still significant reductions of 15 percent or more for all road users.
Rob Viola, the director of safety policy and research at NYC DOT, says that overall, the results of the study should be seen as “validating our approach” of using a variety of tactics to improve the design of the city’s streets.
“We’re getting really good safety results after implementation,” Viola says.
Local Evidence for Safer Streets
The projects were originally evaluated as part of NYC DOT’s Pedestrian Safety and Older New Yorkers study, which looked at the impact of street improvement projects on pedestrian injuries and deaths among senior citizens. The additional study broadened the data to all road users, with separate results for pedestrians and motorists. Injury data specifically for cyclists were not included in the study, though a separate 2021 report looked at the impact of street interventions on risks for bikers.
The study was made easier with the development of an internal tool for mapping street improvement projects, which can be paired with data on crashes and injuries, Viola says. That information “used to be scattered across spreadsheets and emails, and now every year when our planners do something, it gets mapped and all of the features of the projects are mapped along with it so it’s fairly easy to aggregate the projects and say, 'Let’s look at that kind of treatment,’” he says.
The data suggested that interventions which give more street space to pedestrians have the best results for lowering the risk of serious injury and death. Somewhat to the department’s surprise, that includes curb extensions, also known as “neckdowns,” which reduce the distance that pedestrians have to cover to cross a street. Those interventions were associated with a 34.1 percent decrease in deaths and serious injuries, according to the report.
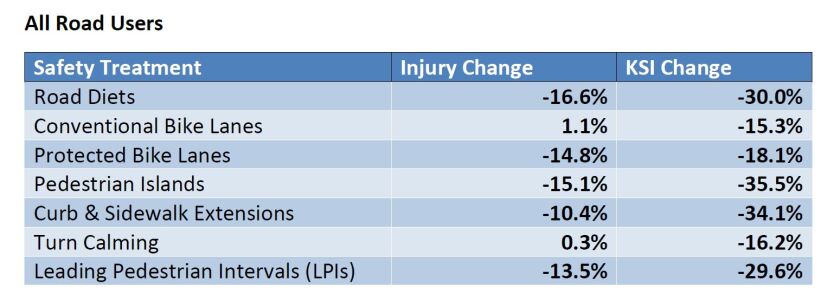
New York City Department of Transportation, Safety Treatment Evaluation (2005-2018). Published 2022.
Another important takeaway was that conventional bike lanes, which involve little more than paint, did result in significantly fewer deaths and serious injuries. Protected bike lanes, which are separate from traffic by medians, parking space or other infrastructure, were more effective — but painted lanes are also useful, Viola says.
“If there is a possibility and a need and the space available for a protected facility, that’s what we want to build. That is the gold standard. But I think it just validates that it doesn’t have to be an all-or-nothing approach, which you sometimes hear from advocacy groups,” he says.
Bigger Picture: The Streets Are Deadly
Viola notes that one reason the interventions showed such substantial reductions is because they were well-placed on very dangerous streets. If the city were to implement some of these changes on all of its streets, the reductions in injuries would be smaller.
Around the country, traffic deaths and pedestrian deaths are on the rise. As Smart Growth America recently outlined in its report, Dangerous by Design, roads have become substantially deadlier across the board since the start of the pandemic. The U.S. is notably becoming more dangerous for pedestrians and drivers even as other developed nations are becoming safer, says Beth Osborne, director of Transportation for America and vice president of transportation and thriving communities for Smart Growth America. She says New York’s report on street improvement projects, along with its broader library of studies, are rare examples of evidence-based accountability from the authorities that design streets.
“To be a professional agency, you need to do exactly what New York is doing: You try things. You go and study to see if you got what you expected. And if you did, you make it more widespread and if you don’t, you [reconsider],” Osborne says. “The tragedy is NYC DOT is a standout. We almost never check on what state DOTs or city DOTs promise.”
For years, campaigns to reduce traffic fatalities around the country have fought for results. In the last decade, many cities have adopted the Vision Zero framework of committing to the elimination of traffic deaths entirely. But what that means on the street can vary wildly from place to place, based on the commitments of local leaders and the practices of local engineers.
Tiffany Smith, a program manager at the Vision Zero Network, says that the initiative is broadly about getting cities to think proactively about reducing deaths and serious injuries on their roadways, rather than reacting to specific incidents. It accounts for the inevitability of human error on the roadways, rather than expecting all drivers to obey all laws and drive perfectly. New York is a good example of a city taking that challenge seriously, Smith says, along with places like Austin, Texas, and Hoboken, N. J., which hasn’t had a traffic death in four years.
The Vision Zero approach is based on a knowledge of what kinds of designs lead to less conflict on the roads, says Osborne. The Federal Highway Administration has begun to publicize more safety countermeasures, she says. Studies like the ones NYC DOT is doing are valuable evidence for future designs, but unfortunately rare.
“I think we’re quietly and slowly, with the help of cities like New York, building up that proven list of interventions that work, and which work the best,” Osborne says. “The question is, do we really care? It seems to me that New York City really cares — this is a city that does value their pedestrians — but I don’t think safety is actually a priority in most of the country. What they want is the most safety you can get as long as you don’t have to slow down traffic.”
Related Articles