In Brief:
Whichever way the political winds blow, it’s clear who’s going to shoulder the burden of building America’s future. Almost 8 out of 10 of the new workers joining the workforce between now and 2030 will be Latino. It might be time for community leaders to understand this population better, from its nuances to its needs.
It takes a little effort get a grip on the diversity that the word “Latino” (or Hispanic) encompasses. It is defined by ancestry in a country where Spanish is the primary language. Spanish is the official language in 21 countries in North, South and Central America, Africa, Europe and the Caribbean and is spoken by the majority of the population in several more. (Brazil isn’t on the list because its official language is Portuguese, though some object to this.)
Demography is still adjusting to scientific consensus that “race” is a social construct, a reflection of genetic diversity rather than fundamental biological differences. The Census Bureau does ask questions about race, and in the 2021 American Community Survey (ACS), more than twice as many Hispanics identified themselves as members of two or more races, or “some other race,” than as white.
Americans who identify as Hispanic in the ACS also include those who are Black, Asian and American Indian. In its surveys, the Pew Research Center uses the approach, “you are Hispanic if you say you are.”
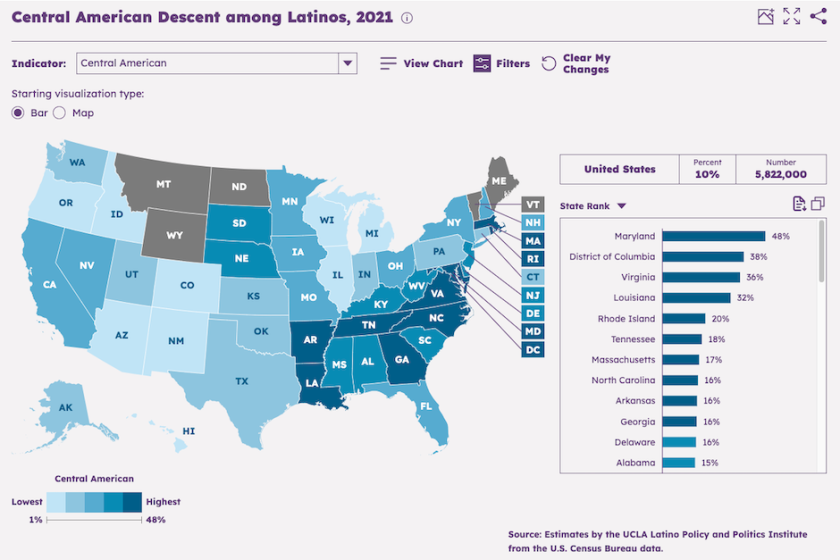
This doesn’t mean that there are no distinct aspects of culture, values, needs, opportunity or lived experience within the Latino community. A new online resource from UCLA’s Latino Policy and Politics Institute (LPPI) makes it possible for state and local leaders to gain important insights about the Latino population that can inform government policy and practice.
Not a Monolith
The Latino Data Hub, launched in October, gives users a wide range of search parameters ranging from country of origin, citizenship status and employment to education, family wellness and access to health insurance. It offers numerous ways to combine data points and to create visualizations from queries. Access to the platform is free and, importantly, it is available in Spanish as well as English.
Jie Zong, senior research analyst for LPPI, manages the Latino Data Hub and helped lead its development. The hub draws on raw Census data, and the plan is to update it continuously as the Census Bureau releases new information.
While the impetus behind the project is to increase understanding of the Latino population, the data set includes everything the Census Bureau collects; users can make queries about any racial or ethnic group. The development process for the Data Hub included an extensive review of existing dashboards with an eye toward engineering an intuitive user experience. Zong thinks some may find it easier to use than official Census data products.
LPPI has characterized the Latino population as “a mosaic, not a monolith.” The Data Hub allows sorting by state and county level, and Zong hopes that government stakeholders will set aside their assumptions about social and demographic characteristics and use it to gain a more accurate picture of those who live in their jurisdictions.
This is especially relevant as large Latino populations are developing in states where they haven’t traditionally settled. “I would strongly recommend that they not assume all Latinos are Mexican, not all of them only speak Spanish,” says Zong.
While emigrants from some Central American countries tend to be less educated, those from certain South American countries are likely to be highly educated, she says. Reports, maps and charts can be generated to create a refined understanding of who makes up the Latino community in a jurisdiction, and what local strengths and needs might be.
Striking Findings
Zong cites recent research by LPPI regarding the Latina workforce as an example of the insights the disaggregated data in its tool can provide. Latinas make up the majority of the female workforce in California, but their median hourly wage is lower than that of any other racial or ethnic group.
Taking educational attainment into account, the findings were even more surprising. “Latinas who have a bachelor’s degree earn 51 cents for every dollar earned by white men in California who have bachelor’s degrees,” Zong says. “This kind of data is very striking, and undisclosed because it takes effort to do the data analysis — we’re trying to streamline that.”
For Veterans Day, LPPI used the Data Hub to take a look at the characteristics of the Latino veterans community. While the country’s total veteran population has decreased since 2000, Latino representation has doubled, from 4 to 8 percent, and is expected to reach 14 percent by 2040.
A significant story came into view behind these numbers, Zong says. Latinos who had served all had health insurance, were better educated, had higher English proficiency, had high median household income and were more likely to be homeowners.
This kind of research could be critical to building paths that lead the predominant source of new workers to careers that offer good wages and bolster local economies.
“As a social scientist, I don’t only care about employment outcomes,” Zong says. Employment outcomes are a function of education and social networks.
“You can’t talk about tapping into a labor force without talking about training, apprenticeship programs, improving English proficiency or understanding cultural competencies and the benefits that come from being a Latino.”

A chart created on the Latino Data Hub offers a striking view of the Latino share of the population in Los Angeles County, especially noteworthy in the 18-64 age range.
Related Articles