In Brief:
Phoenix, Ariz., is America’s hottest large city. On July 18, it set a new record for the most days in a row with a temperature of at least 110 degrees Fahrenheit, and it's possible the record will be broken again.

That’s not the only record being set. Maricopa County, where Phoenix is located, is the nation’s fastest-growing county. This confluence could be viewed as a disaster in the making. But could it also be seen as a learning opportunity for the growing number of local governments coming to grips with extreme heat? One in three Americans have experienced it in recent weeks.
Temperatures high enough to cause public health problems will be a recurring challenge in a warming world. This isn’t news to scientists, but punishing heat in recent years — including deadly events in unexpected parts of the country — is driving this reality home to local government.
“The Pacific heat dome of 2021 was quite a big wake-up call to many communities across the country that thought they were safe from climate change-related heat events,” says Ladd Keith, an assistant professor in the School of Architecture, Planning and Landscape Architecture at the University of Arizona. A research associate at the university’s Udall Center, he studies governance and design practices that can help communities improve their heat resilience.
Maps predicting future heat risk make it evident that historically hot urban areas are headed in the wrong direction, but that doesn’t mean that cooler communities won’t also experience extreme heat events, Keith says. “It’s extremely important that all communities know that they need to be prepared for them, whether they fall in or out of a particular map.”
Extreme heat is a risk to all, but fatal consequences are linked to factors that can be identified and addressed.
A Low Threshold of Concern
Estimates of annual deaths from heat vary greatly. The Centers for Disease Control and Prevention (CDC) says that 702 heat-related deaths occur each year; according to the National Weather Service, the 10-year average is 153. A 2020 study published in Environmental Epidemiology looked at mortality data in 297 counties with populations greater than 100,000. Their analysis, which encompassed just under two-thirds of the country’s population, suggested an average 5,608 heat-related deaths each year during the study period.
According to the 2022 Heat Deaths Report from the Maricopa County Department of Public Health, the county had 425 “heat-associated” deaths in 2022, a combination of fatalities caused directly by heat and those in which heat was a contributing factor. The report offers a detailed and nuanced look at the factors that make extreme heat deadly.
The 2022 number was 25 percent higher than the year before, but more strikingly, it was more than twice the average seen between 2016 and 2019. Factors other than heat have been at play over this period, including changes in health-seeking behavior during the pandemic, says Ariella Dale, a health scientist for the department. But the tragedy, she says, is that each of these deaths were preventable.
Eighty percent of those who died were male; 80 percent became overheated outdoors. Two-thirds were 50 or older. Nearly 7 in 10 heat-associated deaths involved drugs or alcohol, methamphetamine 90 percent of the time. Among the 425 fatalities, 178 persons were known to be homeless.
This kind of analysis is essential to ensuring effective response in extreme heat events. If a community does not already have experience dealing with heat, Dale says, a first step is evaluating gaps in communication and services for communities at highest risk. These tend to be the same groups — the old, the unhoused, the poor — that are most vulnerable to infectious disease outbreaks and other preventable health problems.
In addition to educating members of the public about hydration, staying indoors and mitigating risks from such things as strenuous exercise and alcohol consumption on hot days, it’s important to create a culture of mutual awareness. All indoor deaths in 2022 occurred in uncooled environments, and more than half were only discovered by welfare checks.
“It can be hard for older folks who are on medication, or those who are using substances, to recognize that they are overheating,” Dale says. “Think about having a low threshold of concern and checking in on the people that you care about.”

(Maricopa County Association of Governments)
A Network for Heat Relief
One of the features on the website of the Maricopa Association of Governments (MAG) is an interactive “heat relief” map showing the locations of cooling centers, hydration stations and collection sites for water bottle donations. The county’s Heat Relief Network, a voluntary regional partnership between local governments, businesses, faith-based groups and service providers, operates between the beginning of May and the end of September.
Cleo Warner, human services planner for MAG, describes the network as a loosely coupled group of “lateral partners” that come together each heat season. The association’s most significant contribution to these efforts is maintaining the map that can help residents connect to its resources.
These include “respite centers,” indoor air-conditioned facilities that allow for those overcome by heat to sit or lay down until they recover. Volunteers at some of these facilities receive first aid training; all follow CDC guidelines for heat relief.
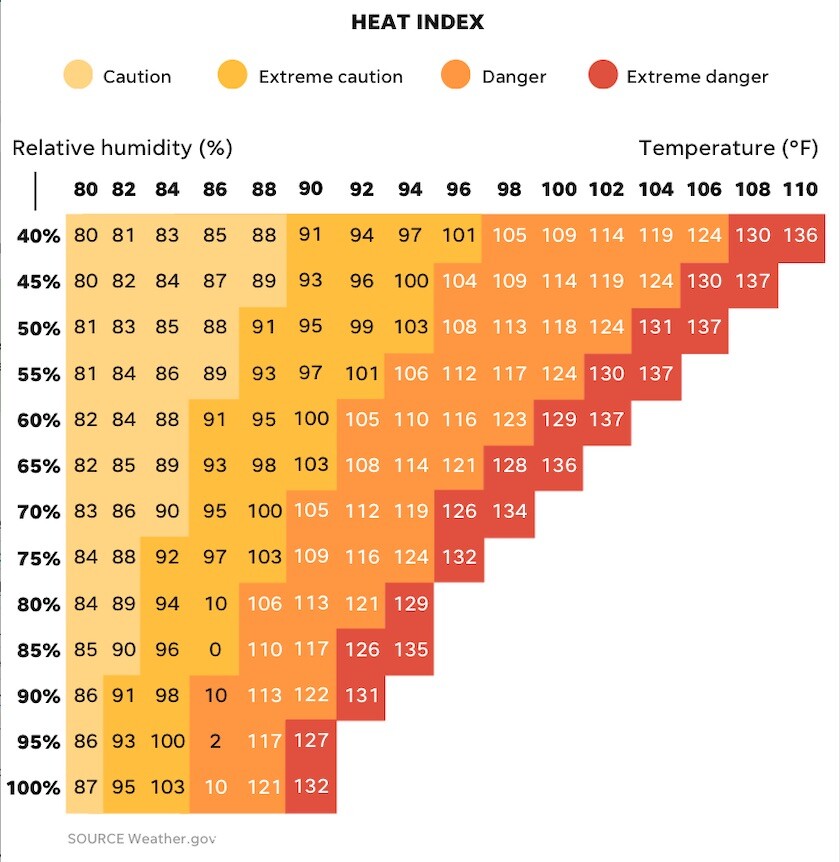
The network offers a means of immediate response in extreme heat events. “Extreme heat” conditions exist when hotter than average weather persists for an extended period. It’s not just a matter of temperature, but of the combined effect of temperature and humidity, known as the “heat index.”
Higher humidity interferes with the cooling effect of sweating and can make hot air temperatures feel even hotter. At 60 percent humidity, a temperature of 92 degrees Fahrenheit feels like 105, which falls within NWA’s “danger zone.” High daytime temperatures are not the only concern, says Dale. Nighttime temperatures in the mid 80s or above can make it hard for bodies to cool off. “You have to look at the lows and the highs.”
Tips on heat management from the world's first chief heat officer.
MAG is implementing an intake questionnaire at its cooling and respite centers to learn more about how people are finding them and to inform communication efforts. It’s increasing coordination with homeless service providers and shelters. Phoenix provides printed maps of service locations to reach those without easy web access.
“Our fatality rate has been increasing every summer, and the need just continues to grow,” says Warner. “We’re trying to fill that need every year; the major partners are better coordinated than we have been in 10 years and we’re trying to figure out how to push this forward together.”

(Weather.gov)
Design for Mitigation
Heat management is the on-demand aspect of urban heat resilience. The long-term objective is heat mitigation — adapting, rethinking and redesigning urban spaces so that they do not intensify atmospheric heat.
Ladd Keith is the lead author of Planning for Urban Heat Resilience, a guide published by the American Planning Association (APA). Produced with support from the National Oceanic and Atmospheric Administration, it is available to the public at no cost.
Thousands of professionals are working to protect against flood risk, but coordinated efforts to mitigate urban heat are in their early days, Keith says. The problem touches entities that may not usually work together in urban communities, from planning departments and public health to emergency management and weather service offices.

(Ladd Keith)
“Most people on the ground understand that heat is a hazard, most professionals see things heating up around them,” Keith says. “Whether they attribute that to climate change or not, we’ve seen interest from communities across the country regardless of political leaning — I haven’t seen any places that are less willing to act on a local level."
City streets and buildings are covered with heat-trapping material. Cool roofs and pavement can alleviate this, as can surface coatings on streets and shade trees along roadways. Shade structures and shade sails can have an immediate impact on urban heat islands. Shaded spaces at transit stops can provide immediate relief and potentially increase the appeal of mass transit. Solar panel installations in parking lots or on playgrounds create both shade and energy.
Tree planting and “green infrastructure” — bioswales, rain gardens, tree wells and other urban infrastructure that can help keep rain where it falls — can provide shade and maximize the cooling effect that results when water evaporates into the atmosphere. Development that preserves natural spaces as much as possible has the same effect.
These are just some of the strategies outlined in APA’s planning guide. Its comprehensive approach depends on understanding all the factors that contribute to urban heat and their place-based variability, including increased heat intensity in underserved communities with low levels of vegetation, higher concentrations of heat-trapping surfaces and buildings with inadequate cooling.
Federal funds are helping move projects forward that can advance both climate and heat relief goals. Communities that are just beginning to think about addressing heat risk need to work out who to bring to the table, Keith says.
“Urban planners, public health professionals, emergency managers and the local National Weather Service office are probably the most critical people to have to start that conversation with, then expand it out to nonprofits and faith-based organizations.”

(Maricopa County Department of Health)
Things Have Changed
Projections regarding the future frequency of extreme heat events vary. The First Street Foundation predicts that 100 million Americans will live in an extreme heat belt with temperatures exceeding 125 degrees Fahrenheit by 2053. This estimate is based on the maximum temperature possible in the seven hottest days of the year in these regions, Keith notes.
A map from the Climate Impact Lab takes a different approach, showing average temperature increases during June, July and August. Even under a mid- to high-level emission scenario, the greatest increase above historical averages by mid-century in this projection is 5 degrees Fahrenheit, concentrated mostly in Kansas and Nebraska.
Whatever the numbers might be, the National Climate Assessment is unambiguous: The annual average temperature over the contiguous United States has increased in recent decades, and will continue to increase regardless of future emissions. “Extreme high temperatures are projected to increase even more than average temperatures,” the authors say. “Cold waves are projected to become less intense and heat waves more intense.”
The idea that local communities might have some control over managing or mitigating heat — and that all should be thinking about their vulnerability — is relatively new, says Keith. But it’s gaining momentum as the realization dawns that this climate impact exists now, not far off in the future.
“Communities that are cooler historically may fall outside of future heat risk maps, but that doesn't mean that they're safe from extreme heat events,” says Keith. “It’s really important that all communities know that they need to be prepared for them — they could happen anywhere in the world at this point.”
Related Articles


