The Census Bureau compiles data on education spending per pupil and elementary and secondary education revenues for each state in their
Annual Survey of School System Finances. The most recent data, released on May 11, 2020, is from the 2018 fiscal year.
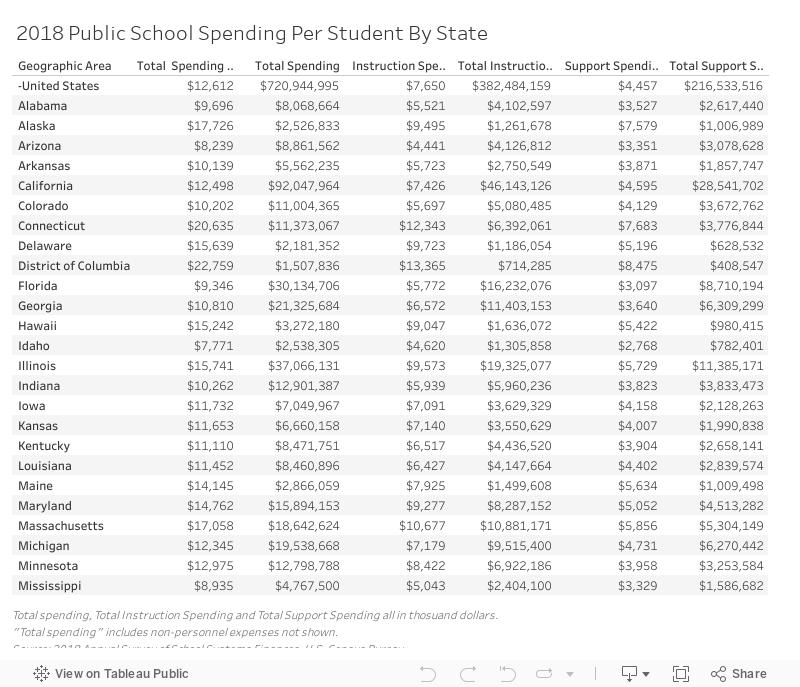
Nationally, the 2018 data indicates $12,612 is spent on public education per student, up nearly $1,000 as
compared to the 2016 data. Significant variation exists across states; New York spends more than $24,000 per student, while states like Utah and Idaho report spending less than a third as much.
(See also: the 2017 data)
There are
many different factors and conditions within states that influence each state's education spending totals. Some of the more prominent factors include cost of living, class sizes and student demographics.
Expenditures shown in the following table reflect current spending, which does not include capital outlays, interest on debts and payments to other governments.
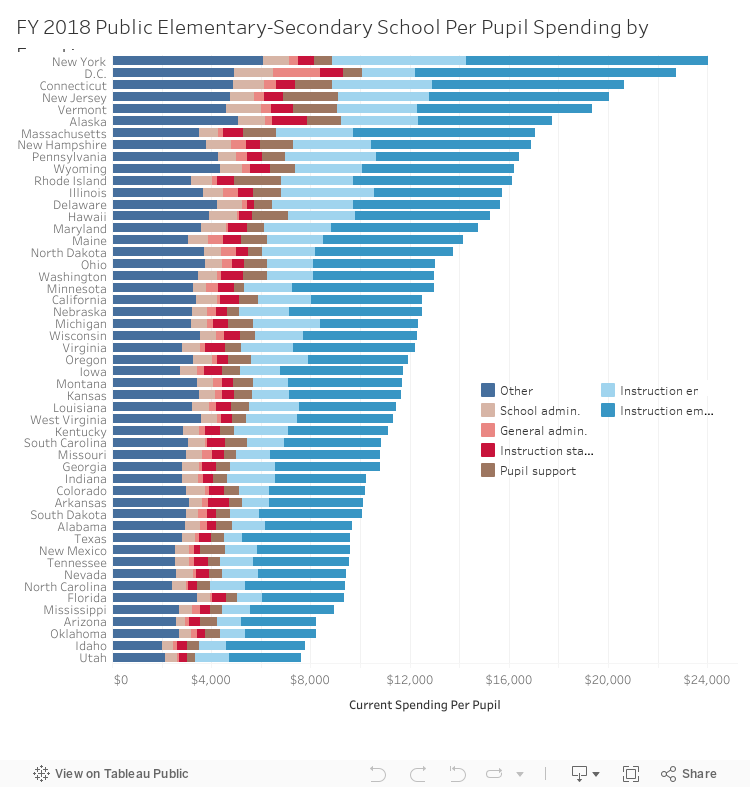
For most states, instructional employees typically account for slightly more than half of total education spending per student. Support staff and administrative expenses also account for varying expenses. The chart below illustrates the major components of education spending per pupil and the variations by state.
Zoe is a former digital editor for Governing.