Internet Explorer 11 is not supported

For optimal browsing, we recommend Chrome, Firefox or Safari browsers.

State Population By Race, Ethnicity Data

Newly released data shows an increasingly diverse American population. About 30 percent identify as racial or ethnic minorities, according to the latest Census Bureau estimates.

A USA country map made up of people icons
Ink Drop/Shutterstock
The Census Bureau's American Community Survey (ACS) is an annual survey about the nation and its people, including information about occupations, education, veterans, home ownership and transportation. This article uses data from the 2019 ACS that was released on Oct. 15, 2020, which is the most current data available. (Also see the 2017 ACS data.)
The latest Census Bureau estimates suggest about 30 percent of Americans identify as racial or ethnic minorities. Nationally, the largest racial demographic groups as of 2019 were:

  • White, alone: 72 percent
  • Black or African American, alone: 12 percent
  • American Indian and Alaska Native, alone: 0.9 percent
  • Asian, alone: 5.7 percent
  • Native Hawaiian and Other Pacific Islander, alone: 0.2 percent
  • Some other race alone: 5 percent
  • Two or more races: 3.4 percent
Separately, Hispanics of any race accounted for 19 percent of the U.S. population.

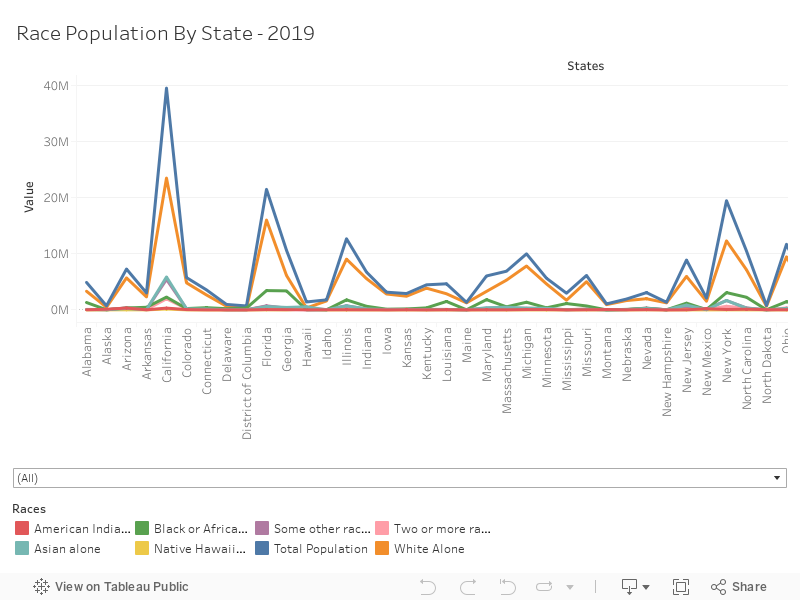
The following graph represents state population totals by race, current as of 2019:

 
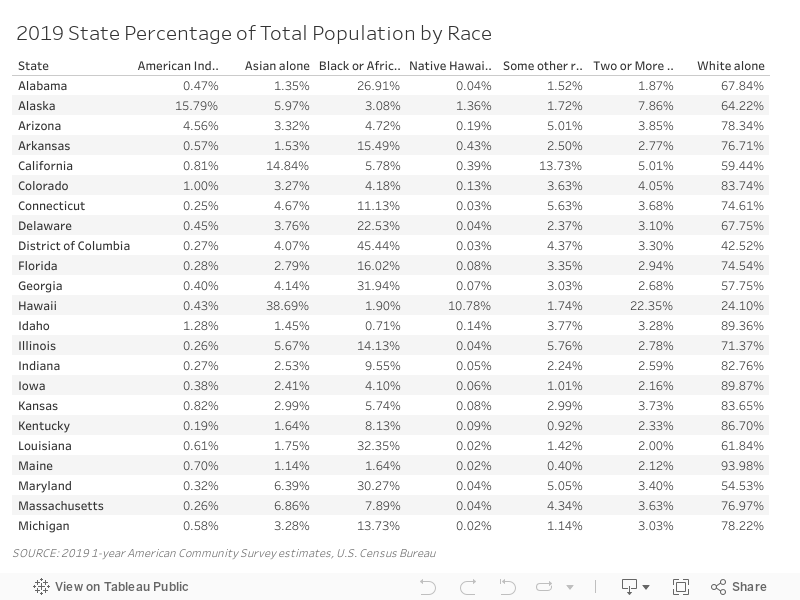
The following table represents state population percentage totals by race, current as of 2019:

Tags:

Data Reports
Zoe is the digital editor for Governing.
From Our Partners