

The federal government currently employs about 2 million full-time employees, excluding Postal Service workers.
States with the most federal civilian employees as of June 2018 were California, the District of Columbia, Virginia, Maryland and Texas. The vast majority of all federal employees -- about 79 percent -- work outside the D.C. region.
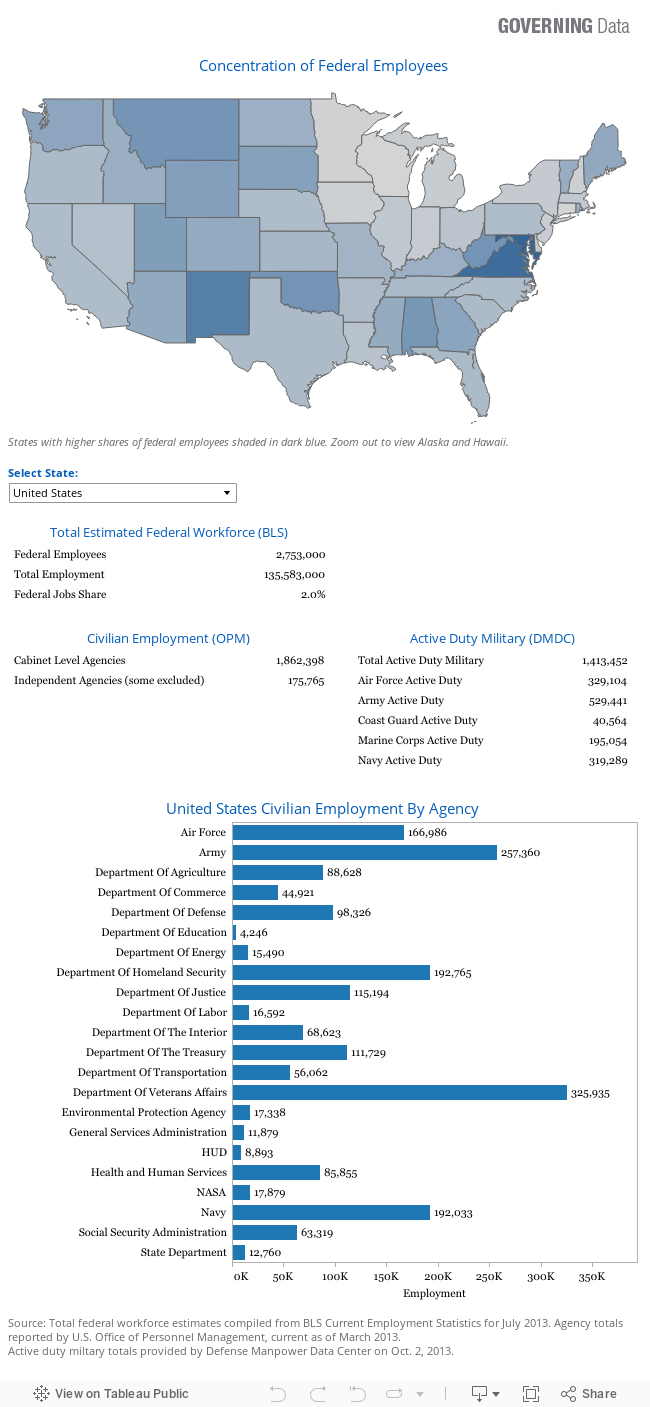
The U.S. Postal Service -- a quasi-governmental agency -- employs about 600,000 workers, the single largest segment of the civilian federal workforce. Other agencies employing the most civilian employees include the Army, Navy and Department of Veterans Affairs. More than a million active duty military further account for a significant portion of federal employment. (See active duty totals by state here.)
Choose a state below to view its federal employment totals and statistics for federal agencies. Civilian employment figures from the Office of Personnel Management (OPM) do not include job totals for the Postal Service and several smaller agencies.
About the data
- Labor Department Federal Employment Estimate: Represents calculated 2018 annual average total federal employment, including Postal Service workers.
- Civilian Employment: U.S. Office of Personnel Management (OPM), current as of June 2018. OPM figures do not include employment for the Postal Service and a limited number of smaller agencies.
- Postal Service: Estimates from the Labor Department's Quarterly Census of Employment and Wages (QCEW), current as of June 2018
- Military Active Duty and Reserve: Defense Manpower Data Center, current as of September 30, 2018. These numbers strictly reflect personnel permanently assigned for duty at the locations shown.
