Comments
Add Your Comment
Comments must be fewer than 2000 characters.
The map below illustrates combined pre-K enrollment for three and four-year-olds. Click a state to view its 2010-2011 enrollment and spending figures, compiled by the National Institute for Early Education Research.
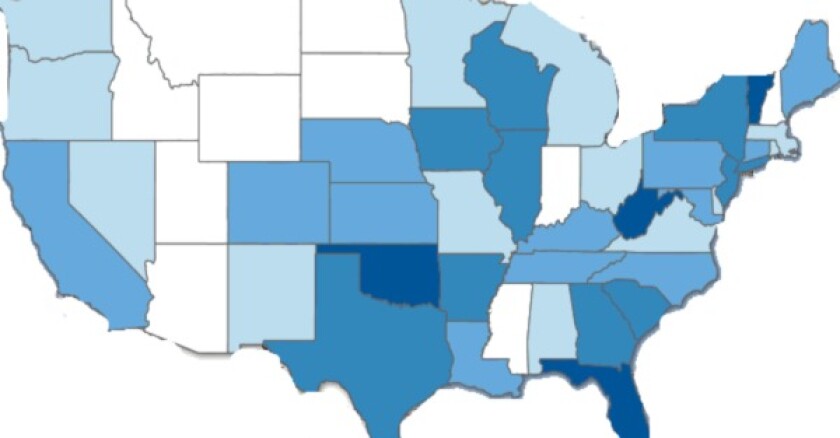
Pre-K funding has declined in most states, with some areas reporting significant reductions. At the same time, state early education enrollment rose by nearly 31,000 last year. Nationwide, 28 percent of 4-year-olds and 4.3 percent of 3-year-olds attended a state pre-k program.
States shaded in white on the map do not have state-funded pre-K programs.
Click a state to view its enrollment and spending figures, compiled by NIEER. To read notes associated with data for each state, refer to Tables 2 (p.14) and 6 (p.18) of the NIEER report.
|
|
|
|
|
|
| No program | < 10% | 10 to < 20% | 20 to < 30% | More than 30% |
GOVERNING Data is your source for state and local government statistics and public records.
Feel free to use any data or visualizations in your own reports with attribution and a link to the source.
Contact: Mike Maciag, mmaciag@governing.com
The U.S. economy added only 88,000 jobs last month, far below economists' expectations.
The Metro Economies Most Dependent on Manufacturing Jobs
Survey Ranks Most (and Least) Small Business-Friendly States, Cities
Unemployment Rate Falls in 22 States
Immigrant Population Growing Faster Than Natives in Many Metro Areas
The number of small businesses in the nation that are subject to licensing regulations by multiple agencies or governments, according to a recent survey.