
But there are antidotes to the problem, and among the best could be sidewalks and bike lanes. Such infrastructure not only facilitates outdoor recreation and an alternative to congested roadways, but data shows it delivers slimmer waistlines in some of the nation’s largest metropolitan regions.
A Governing review of census and CDC data finds communities where more residents walk or bike to work boast significantly healthier weights. The analysis of 2010 statistics for 126 metropolitan areas finds these communities are strongly correlated with higher numbers of residents who are neither obese nor overweight.
Historically, studies have linked trails, sidewalks and bike lanes with an increase in walking or cycling. As medical costs continue to rise and evidence mounts that such infrastructure also improves well-being, more officials might look to give health consideration greater standing in transportation planning.
“The more access that people have to these kinds of places, the more likely they are to be healthy,” said Susan Polan, associate executive director for public affairs and advocacy with the American Public Health Association.
Metropolitan regions with the healthiest weights are home to high counts of walkers and bike commuters.
Approximately half of Fort Collins-Loveland, Colo., metro area residents are neither overweight nor obese. That might not sound like a lot, but it’s the highest percentage of healthy residents of all metro areas surveyed in the CDC’s 2010 Behavioral Risk Factor Surveillance System, an annual telephone survey measuring a range of health issues. Accordingly, census figures indicate 5.3 percent of Fort Collins-Loveland area commuters walk or bike as their primary form of transportation to work, one of the highest rates in the country.
Five of the top 10 healthiest metro areas in terms of weight were among the 10 regions with highest percentages of residents walking or biking to work in the Governing analysis. Although tallies of walkers and bikers are small compared to all commuters, many who walk or bike to public transit stations aren’t counted in the Census Bureau’s American Community Survey data, and significantly more exercise outdoors outside of their daily commutes.
The CDC considers those with sizable weights for their height (body mass index of 30 or greater) to be obese, and others who are not quite obese, but exceeding healthy weights, to be “overweight.”
While only a fraction of workers in an area may opt to bike or walk to work, having the necessary infrastructure in place compels others to use it more regularly.
Spending hours a day in a car or living a sedentary lifestyle makes it difficult to shed pounds. Exercising helps, and eating habits, medical conditions and other factors understandably drive obesity rates as well.
Along with commuting habits, other measures showed statistically significant relationships with healthy weights in the analysis. Healthier metro areas were most closely correlated with the portion of a region’s population holding at least a bachelor’s degree. The Bridgeport-Stamford-Norwalk, Conn. metro area, a wealthy region ranking near the top in education attainment, recorded the lowest obesity rate in the CDC's 2010 survey.
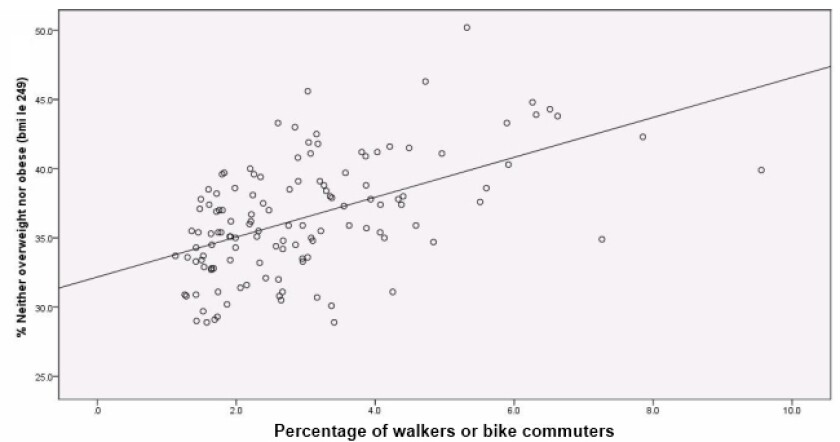
Still, the correlation between commuting and residents not considered obese nor overweight was strong--16 percent greater than the relationship with median household income. An area’s average commute time was slightly correlated with weight, but was not statistically significant.
Scatter plot of metro areas' walkers/bike commuters correlated with healthy weights:
The CDC recommends a range of infrastructure for communities to rein in obesity. Bike lanes, shared-use paths and bike racks promote cycling. Urban design with adequate sidewalks, lighting, street crossings and similar features supports walking and other physical activity. The agency also suggests localities work to cut miles driven on roadways.
American Public Health Association's Polan cited public transit projects and converting old rail lines into trails as two of the more popular initiatives localities pursue. It’s particularly important, she said, to encourage kids to walk to school and educate them about pedestrian safety at a young age.
Last year, Los Angeles County, Calif., earmarked nearly $16 million in funding for an initiative aimed at curbing obesity, part of which included expanding bike networks and promoting open spaces.
“There are a lot of smaller initiatives that can engage and energize people and make them realize what a difference they can make at the local level,” Polan said.
When cutting expenses, health costs are an easy target. A recent study by two Lehigh University researchers reported obesity-related costs accounted for $190 billion annually in U.S. health expenditures, nearly 21 percent of the country’s total bill.
Advocates often push for related projects in transportation planning, but the amount of weight officials actually give to health concerns varies. While it may be a major consideration in some communities, others focus strictly on economic concerns, Polan said.
John Norquist, president of the Congress for the New Urbanism, said many American cities have taken steps in recent years to promote walking and biking.
To improve walkability, connected street grids – with slower speed limits and no more than two lanes in each direction – are a key component, he said.
Those looking to move can use the popular walkscore.com website to measure how accessible an apartment or home’s various neighborhood amenities are on foot. Norquist, whose group advocates mixed-use and transit-oriented development, cited New York City, San Francisco, Denver and Albuquerque, N.M., as cities making strides in developing walkable communities.
Biking has also accelerated, Norquist said, particularly in Seattle and other older urban environments. “The old downtowns are in great shape for biking,” he said.
Young people’s attitudes toward biking and public transit have shifted, with more seeking alternatives to long car rides, Norquist said. Bicycle manufacturers have joined in the push to remake communities, hiring lobbyists to pressure Washington and support more bike-friendly transportation planning policies.
The emphasis on healthy lifestyles in urban design isn’t new, though. Richard Jackson, a former head of the CDC’s National Center for Environmental Health who has since become one the movement’s most vocal proponents, published an article linking built environments to adverse health effects back in 2001.
Norquist said that the benefits of walking and biking have now become one of the central themes of urbanists’ arguments for urban revival as recreation represents an increasingly key aspect of living downtown.
“It’s really going to be a big factor, because people want to be healthier,” he said. "It's a very personal thing."
View a summary of the methodology and results
Data
The CDC’s Behavioral Risk Factor Surveillance System measures obesity and other health factors. The table below shows 2010 estimates for each geographic region surveyed, most of which are metro areas. Click here for a complete list of communities included in the 2010 survey, along with specific counties comprising each area.
The following definitions describe the data:
-- Healthy weight: Neither overweight nor obese
-- Overweight: Body mass index of 25-29.9
-- Obese: Body mass index of 30-99.8
-- No physical activity: Respondents reporting doing no physical activity or exercise in the past 30 days
| Area | Healthy Weight | Overweight | Obese | No Physical Activity |
|---|---|---|---|---|
| Atlantic City-NJ Metro Area | 30.7% | 42.5% | 26.8% | 27.8% |
| Austin-Round Rock-TX Metro Area | 35.9% | 37.1% | 27.0% | 19.3% |
| Bethesda-Gaithersburg-Frederick-MD Metro Division | 42.8% | 37.3% | 19.9% | 17.3% |
| Buffalo-Cheektowaga-Tonawanda-NY Metro Area | 37.9% | 37.5% | 24.7% | 23.9% |
| Charleston-North Charleston-SC Metro Area | 34.7% | 36.4% | 29.0% | 25.4% |
| Charlotte-Gastonia-Concord-NC-SC Metro Area | 37.0% | 35.0% | 28.0% | 22.6% |
| Chicago-Naperville-Joliet-IL-IN-WI Metro Area | 38.8% | 34.2% | 27.0% | 23.3% |
| Coeur d´Alene-ID Metro Area | 35.5% | 39.8% | 24.7% | 18.8% |
| Denver-Aurora-CO Metro Area | 43.0% | 37.4% | 19.6% | 16.2% |
| Durham-NC Metro Area | 41.1% | 32.4% | 26.6% | 22.0% |
| Edison-NJ Metro Division | 38.5% | 37.4% | 24.2% | 26.0% |
| Greenville-SC Metro Area | 32.1% | 33.9% | 34.0% | 26.5% |
| Hickory-Morganton-Lenoir-NC Metro Area | 33.4% | 41.7% | 25.0% | 30.2% |
| Kennewick-Richland-Pasco-WA Metro Area | 33.4% | 35.1% | 31.5% | 24.2% |
| Key West-Marathon-FL Micropolitan Area | 46.0% | 37.1% | 16.9% | 16.9% |
| Kingsport-Bristol-TN-VA Metro Area | 29.9% | 33.4% | 36.7% | 37.6% |
| Little Rock-North Little Rock-AR Metro Area | 29.3% | 36.0% | 34.6% | 23.8% |
| Louisville-KY-IN Metro Area | 33.7% | 35.1% | 31.2% | 25.2% |
| Miami-Fort Lauderdale-Miami Beach-FL Metro Area | 34.2% | 37.5% | 28.3% | 24.1% |
| Myrtle Beach-Conway-North Myrtle Beach-SC Metro Area | 32.2% | 41.2% | 26.6% | 22.7% |
| Nashville-Davidson--Murfreesboro-TN Metro Area | 37.8% | 37.4% | 24.7% | 26.7% |
| New Haven-Milford-CT Metro Area | 38.8% | 34.9% | 26.2% | 22.1% |
| New Orleans-Metairie-Kenner-LA Metro Area | 30.1% | 37.2% | 32.6% | 26.9% |
| New York-White Plains-Wayne-NY-NJ Metro Division | 40.5% | 37.6% | 21.9% | 24.6% |
| Newark-Union-NJ-PA Metro Division | 38.2% | 37.9% | 23.9% | 26.1% |
| Orlando-Kissimmee-FL Metro Area | 34.3% | 37.4% | 28.3% | 25.3% |
| Panama City-Lynn Haven-FL Metro Area | 34.1% | 37.9% | 28.0% | 23.9% |
| Peabody-MA | 41.0% | 36.7% | 22.3% | 19.6% |
| Phoenix-Mesa-Scottsdale-AZ Metro Area | 36.0% | 41.1% | 22.8% | 18.5% |
| Port St. Lucie-Fort Pierce-FL Metro Area | 35.5% | 36.5% | 28.0% | 22.1% |
| Portland-South Portland-Biddeford-ME Metro Area | 37.6% | 38.6% | 23.9% | 17.9% |
| Portland-Vancouver-Beaverton-OR-WA Metro Area | 40.3% | 33.7% | 26.0% | 15.8% |
| Sacramento—Arden-Arcade—Roseville-CA Metro Area | 40.9% | 35.1% | 24.0% | 15.3% |
| Salt Lake City-UT Metro Area | 41.8% | 34.6% | 23.6% | 18.3% |
| San Antonio-TX Metro Area | 36.7% | 33.5% | 29.8% | 26.5% |
| San Diego-Carlsbad-San Marcos-CA Metro Area | 41.2% | 32.8% | 26.1% | 19.0% |
| San Francisco-Oakland-Fremont-CA Metro Area | 44.8% | 36.9% | 18.2% | 17.4% |
| San Jose-Sunnyvale-Santa Clara-CA Metro Area | 39.7% | 39.1% | 21.2% | 17.0% |
| Santa Ana-Anaheim-Irvine-CA Metro Division | 43.1% | 36.3% | 20.7% | 21.1% |
| Santa Fe-NM Metro Area | 46.3% | 32.9% | 20.8% | 17.9% |
| Scottsbluff-NE Micropolitan Area | 27.9% | 39.1% | 33.0% | 27.5% |
| Scranton--Wilkes-Barre-PA Metro Area | 35.9% | 35.7% | 28.4% | 32.8% |
| Seaford-DE Micropolitan Area | 30.5% | 37.7% | 31.8% | 25.8% |
| Seattle-Bellevue-Everett-WA Metro Division | 42.3% | 34.9% | 22.8% | 16.6% |
| Sebring-FL Micropolitan Area | 35.5% | 35.0% | 29.4% | 28.9% |
| Shreveport-Bossier City-LA Metro Area | 33.2% | 36.3% | 30.4% | 34.1% |
| Sioux City-IA-NE-SD Metro Area | 32.6% | 35.7% | 31.7% | 28.2% |
| Sioux Falls-SD Metro Area | 33.3% | 39.9% | 26.8% | 21.4% |
| Spokane-WA Metro Area | 35.9% | 39.7% | 24.5% | 18.3% |
| Springfield-MA Metro Area | 41.2% | 35.0% | 23.8% | 20.5% |
| St. Louis-MO-IL Metro Area | 36.2% | 33.9% | 29.8% | 25.5% |
| Wichita Falls-TX Metro Area | 32.9% | 39.2% | 27.9% | 28.6% |
| Wichita-KS Metro Area | 38.5% | 34.4% | 27.1% | 22.6% |
| Akron-OH Metro Area | 38.2% | 32.5% | 29.3% | 22.6% |
| Albuquerque-NM Metro Area | 43.3% | 34.9% | 21.7% | 18.0% |
| Allentown-Bethlehem-Easton-PA-NJ Metro Area | 37.5% | 33.5% | 29.0% | 26.1% |
| Amarillo-TX Metro Area | 35.0% | 36.3% | 28.7% | 24.1% |
| Arcadia-FL Micropolitan Area | 32.2% | 33.7% | 34.1% | 35.1% |
| Asheville-NC Metro Area | 37.3% | 35.2% | 27.5% | 22.2% |
| Atlanta-Sandy Springs-Marietta-GA Metro Area | 37.4% | 33.9% | 28.7% | 22.1% |
| Augusta-Richmond County-GA-SC Metro Area | 31.1% | 36.8% | 32.1% | 25.9% |
| Augusta-Waterville-ME Micropolitan Area | 37.1% | 33.4% | 29.4% | 22.3% |
| Baltimore-Towson-MD Metro Area | 33.5% | 38.4% | 28.0% | 24.0% |
| Bangor-ME Metro Area | 31.1% | 35.4% | 33.5% | 24.1% |
| Barre-VT Micropolitan Area | 41.2% | 36.9% | 21.8% | 16.1% |
| Baton Rouge-LA Metro Area | 35.4% | 32.2% | 32.5% | 25.7% |
| Billings-MT Metro Area | 35.4% | 37.4% | 27.2% | 24.0% |
| Birmingham-Hoover-AL Metro Area | 33.7% | 37.0% | 29.3% | 29.2% |
| Bismarck-ND Metro Area | 39.4% | 36.1% | 24.5% | 19.4% |
| Boise City-Nampa-ID Metro Area | 38.0% | 36.6% | 25.3% | 16.6% |
| Boston-Quincy-MA Metro Division | 43.2% | 34.8% | 22.0% | 21.5% |
| Bremerton-Silverdale-WA Metro Area | 34.9% | 36.3% | 28.8% | 15.3% |
| Bridgeport-Stamford-Norwalk-CT Metro Area | 45.6% | 37.8% | 16.6% | 18.8% |
| Burlington-South Burlington-VT Metro Area | 42.3% | 36.0% | 21.7% | 13.6% |
| Cambridge-Newton-Framingham-MA Metro Division | 44.2% | 35.2% | 20.7% | 17.3% |
| Camden-NJ Metro Division | 34.7% | 35.8% | 29.5% | 27.2% |
| Canton-Massillon-OH Metro Area | 35.4% | 36.3% | 28.3% | 26.6% |
| Cape Coral-Fort Myers-FL Metro Area | 40.0% | 34.2% | 25.8% | 27.9% |
| Casper-WY Metro Area | 34.7% | 37.7% | 27.6% | 23.2% |
| Cedar Rapids-IA Metro Area | 41.1% | 33.5% | 25.4% | 25.5% |
| Charleston-WV Metro Area | 30.5% | 37.3% | 32.3% | 31.4% |
| Chattanooga-TN-GA Metro Area | 30.9% | 38.6% | 30.4% | 32.2% |
| Cheyenne-WY Metro Area | 33.8% | 39.2% | 27.0% | 23.1% |
| Cincinnati-Middletown-OH-KY-IN Metro Area | 38.1% | 34.4% | 27.4% | 25.4% |
| Cleveland-Elyria-Mentor-OH Metro Area | 34.4% | 40.9% | 24.7% | 22.7% |
| Colorado Springs-CO Metro Area | 38.6% | 37.8% | 23.6% | 19.1% |
| Columbia-SC Metro Area | 32.9% | 36.1% | 31.0% | 27.7% |
| Columbus-OH Metro Area | 34.5% | 35.0% | 30.5% | 26.3% |
| Concord-NH Micropolitan Area | 36.5% | 40.9% | 22.6% | 16.9% |
| Dallas-Plano-Irving-TX Metro Division | 36.4% | 29.8% | 33.8% | 26.4% |
| Dayton-OH Metro Area | 35.0% | 35.3% | 29.7% | 25.2% |
| Del Rio-TX Micropolitan Area | 25.8% | 32.9% | ||
| Deltona-Daytona Beach-Ormond Beach-FL Metro Area | 34.8% | 38.0% | 27.2% | 23.7% |
| Des Moines-West Des Moines-IA Metro Area | 35.1% | 38.9% | 26.0% | 22.3% |
| Detroit-Livonia-Dearborn-MI Metro Division | 32.9% | 34.0% | 33.1% | 28.3% |
| Dover-DE Metro Area | 29.4% | 38.8% | 31.9% | 30.4% |
| El Paso-TX Metro Area | 30.2% | 41.1% | 28.6% | 28.5% |
| Eugene-Springfield-OR Metro Area | 39.9% | 30.1% | 30.0% | 18.2% |
| Evansville-IN-KY Metro Area | 37.0% | 33.7% | 29.3% | 27.7% |
| Fargo-ND-MN Metro Area | 37.8% | 36.8% | 25.4% | 26.6% |
| Farmington-NM Metro Area | 35.0% | 31.4% | 33.7% | 22.9% |
| Fayetteville-Springdale-Rogers-AR-MO Metro Area | 38.5% | 37.1% | 24.4% | 26.2% |
| Fort Collins-Loveland-CO Metro Area | 50.2% | 28.5% | 21.3% | 13.1% |
| Fort Wayne-IN Metro Area | 30.9% | 36.0% | 33.2% | 23.4% |
| Fort Worth-Arlington-TX Metro Division | 30.3% | 34.4% | 35.3% | 24.0% |
| Gainesville-FL Metro Area | 43.8% | 36.0% | 20.1% | 19.1% |
| Grand Island-NE Micropolitan Area | 31.2% | 39.9% | 29.0% | 26.2% |
| Grand Rapids-Wyoming-MI Metro Area | 34.8% | 38.7% | 26.6% | 19.3% |
| Greensboro-High Point-NC Metro Area | 32.7% | 38.6% | 28.7% | 23.4% |
| Hagerstown-Martinsburg-MD-WV Metro Area | 34.3% | 33.6% | 32.1% | 27.7% |
| Hartford-West Hartford-East Hartford-CT Metro Area | 38.0% | 37.9% | 24.2% | 19.5% |
| Hastings-NE Micropolitan Area | 33.4% | 35.8% | 30.8% | 26.0% |
| Helena-MT Micropolitan Area | 39.3% | 39.6% | 21.1% | 18.4% |
| Hilo-HI Micropolitan Area | 39.4% | 33.9% | 26.8% | 19.2% |
| Hilton Head Island-Beaufort-SC Micropolitan Area | 40.2% | 37.5% | 22.4% | 19.0% |
| Homosassa Springs-FL Micropolitan Area | 38.3% | 38.0% | 23.7% | 22.7% |
| Honolulu-HI Metro Area | 43.9% | 34.2% | 21.9% | 19.7% |
| Houston-Sugar Land-Baytown-TX Metro Area | 36.9% | 34.0% | 29.1% | 23.6% |
| Huntington-Ashland-WV-KY-OH Metro Area | 30.6% | 35.8% | 33.5% | 30.2% |
| Idaho Falls-ID Metro Area | 35.9% | 35.8% | 28.3% | 19.4% |
| Indianapolis-Carmel-IN Metro Area | 36.2% | 35.7% | 28.2% | 23.5% |
| Jackson-MS Metro Area | 33.3% | 33.5% | 33.3% | 31.5% |
| Jacksonville-FL Metro Area | 38.6% | 35.4% | 26.0% | 27.9% |
| Kahului-Wailuku-HI Micropolitan Area | 37.1% | 35.9% | 27.0% | 16.4% |
| Kalispell-MT Micropolitan Area | 40.5% | 41.2% | 18.3% | 20.4% |
| Kansas City-MO-KS Metro Area | 34.5% | 36.0% | 29.5% | 23.0% |
| Kapaa-HI Micropolitan Area | 44.5% | 31.8% | 23.7% | 16.5% |
| Knoxville-TN Metro Area | 35.4% | 34.1% | 30.5% | 29.1% |
| Lake City-FL Micropolitan Area | 29.7% | 39.1% | 31.2% | 28.0% |
| Lakeland-Winter Haven-FL Metro Area | 29.0% | 33.0% | 37.9% | 26.0% |
| Laredo-TX Metro Area | 29.1% | 37.6% | 33.3% | 34.2% |
| Las Cruces-NM Metro Area | 32.0% | 37.2% | 30.8% | 24.5% |
| Las Vegas-Paradise-NV Metro Area | 39.6% | 37.3% | 23.1% | 23.7% |
| Lebanon-NH-VT Micropolitan Area | 40.2% | 34.6% | 25.2% | 19.6% |
| Lewiston-ID-WA Metro Area | 35.0% | 38.3% | 26.7% | 22.3% |
| Lewiston-Auburn-ME Metro Area | 38.2% | 34.9% | 26.9% | 24.3% |
| Lincoln-NE Metro Area | 37.4% | 32.5% | 30.1% | 18.2% |
| Los Angeles-Long Beach-Glendale-CA Metro Division | 37.5% | 38.2% | 24.3% | 20.8% |
| Lubbock-TX Metro Area | 35.3% | 32.5% | 32.2% | 30.7% |
| Manchester-Nashua-NH Metro Area | 39.7% | 35.8% | 24.5% | 18.7% |
| McAllen-Edinburg-Mission-TX Metro Area | 30.8% | 35.8% | 33.3% | 36.0% |
| Memphis-TN-MS-AR Metro Area | 28.9% | 35.3% | 35.8% | 26.1% |
| Midland-TX Metro Area | 38.5% | 37.6% | 23.9% | 33.3% |
| Milwaukee-Waukesha-West Allis-WI Metro Area | 39.1% | 35.0% | 26.0% | 24.4% |
| Minneapolis-St. Paul-Bloomington-MN-WI Metro Area | 38.4% | 36.7% | 24.9% | 17.1% |
| Minot-ND Micropolitan Area | 30.8% | 40.4% | 28.9% | 26.5% |
| Mobile-AL Metro Area | 32.8% | 33.6% | 33.6% | 30.3% |
| Naples-Marco Island-FL Metro Area | 40.8% | 36.4% | 22.9% | 13.6% |
| Nassau-Suffolk-NY Metro Division | 41.3% | 36.8% | 21.9% | 22.7% |
| Norfolk-NE Micropolitan Area | 29.0% | 38.4% | 32.5% | 28.3% |
| North Platte-NE Micropolitan Area | 33.2% | 34.6% | 32.2% | 28.8% |
| North Port-Bradenton-Sarasota-FL Metro Area | 41.9% | 36.4% | 21.6% | 21.6% |
| Ocala-FL Metro Area | 32.5% | 33.7% | 33.8% | 28.8% |
| Ocean City-NJ Metro Area | 37.0% | 37.6% | 25.4% | 24.9% |
| Ogden-Clearfield-UT Metro Area | 39.6% | 34.2% | 26.2% | 16.5% |
| Oklahoma City-OK Metro Area | 35.1% | 34.8% | 30.1% | 28.5% |
| Olympia-WA Metro Area | 41.5% | 33.7% | 24.8% | 15.2% |
| Omaha-Council Bluffs-NE-IA Metro Area | 37.0% | 37.2% | 25.8% | 23.7% |
| Palm Bay-Melbourne-Titusville-FL Metro Area | 31.4% | 37.4% | 31.3% | 26.4% |
| Pensacola-Ferry Pass-Brent-FL Metro Area | 35.5% | 35.0% | 29.6% | 25.5% |
| Philadelphia-PA Metro Division | 39.9% | 35.7% | 24.4% | 24.2% |
| Pittsburgh-PA Metro Area | 35.0% | 35.7% | 29.3% | 23.6% |
| Providence-New Bedford-Fall River-RI-MA Metro Area | 35.7% | 37.9% | 26.4% | 24.3% |
| Provo-Orem-UT Metro Area | 44.3% | 33.9% | 21.8% | 16.2% |
| Raleigh-Cary-NC Metro Area | 37.1% | 36.0% | 27.0% | 20.4% |
| Rapid City-SD Metro Area | 32.3% | 42.2% | 25.5% | 24.4% |
| Reno-Sparks-NV Metro Area | 42.5% | 36.8% | 20.7% | 19.1% |
| Richmond-VA Metro Area | 32.8% | 41.1% | 26.1% | 26.2% |
| Riverside-San Bernardino-Ontario-CA Metro Area | 35.1% | 36.4% | 28.5% | 23.6% |
| Rochester-NY Metro Area | 37.4% | 34.5% | 28.1% | 19.0% |
| Rockingham County-Strafford County-NH Metro Division | 37.1% | 36.1% | 26.8% | 19.5% |
| Rutland-VT Micropolitan Area | 36.2% | 33.3% | 30.5% | 22.6% |
| Tacoma-WA Metro Division | 32.3% | 36.5% | 31.2% | 19.6% |
| Tallahassee-FL Metro Area | 33.6% | 39.9% | 26.5% | 22.1% |
| Tampa-St. Petersburg-Clearwater-FL Metro Area | 35.5% | 38.2% | 26.3% | 22.1% |
| Toledo-OH Metro Area | 31.1% | 38.6% | 30.3% | 24.7% |
| Topeka-KS Metro Area | 28.9% | 35.0% | 36.1% | 22.3% |
| Trenton-Ewing-NJ Metro Area | 43.3% | 33.6% | 23.1% | 24.8% |
| Tucson-AZ Metro Area | 41.6% | 31.8% | 26.6% | 20.3% |
| Tulsa-OK Metro Area | 33.6% | 36.3% | 30.1% | 29.2% |
| Tuscaloosa-AL Metro Area | 30.8% | 38.0% | 31.2% | 31.0% |
| Twin Falls-ID Micropolitan Area | 35.7% | 33.2% | 31.1% | 25.4% |
| Tyler-TX Metro Area | 39.5% | 35.2% | 25.3% | 26.0% |
| Virginia Beach-Norfolk-Newport News-VA-NC Metro Area | 37.8% | 32.0% | 30.3% | 22.8% |
| Warren-Troy-Farmington Hills-MI Metro Division | 34.4% | 35.2% | 30.4% | 19.4% |
| Washington-Arlington-Alexandria-DC-VA-MD-WV Metro | 37.8% | 37.0% | 25.2% | 19.3% |
| Wauchula-FL Micropolitan Area | 17.6% | 40.6% | 41.8% | 27.2% |
| West Palm Beach-Boca Raton-Boynton Beach Metro Division | 39.9% | 40.1% | 20.0% | 22.6% |
| Wilmington-DE-MD-NJ Metro Division | 35.5% | 34.2% | 30.4% | 23.5% |
| Worcester-MA Metro Area | 39.1% | 35.8% | 25.2% | 19.0% |
| Yakima-WA Metro Area | 31.6% | 37.0% | 31.4% | 25.1% |
| Youngstown-Warren-Boardman-OH-PA Metro Area | 29.7% | 35.5% | 34.8% | 26.4% |
Alternative Means of Transportation Map
Governing compiled 2010 American Community Survey estimates for means of transportation to work for metropolitan statistical areas for the data analysis. Separate data for more than 400 U.S. cities, towns and other census-designated places is shown on the map. Larger icons represent higher total percentages of workers who either walk, bike, use public transportation or another alternate means of commuting to work. (Click to open interactive map in a new window).
