
Data
The Census Bureau’s 2010 American Communities Survey gauges means of transportation to work for various geographical areas. Survey respondents are asked to record the type of transportation used to travel the longest distance during their commute to work. It should be noted that since only a single transportation type for the longest distance can be counted, those walking or biking to rail stations would likely be recorded only as public transportation commuters. Totals for walkers and bikers were added for each metropolitan statistical area (MSA) and divided by the total number of residents age 16 and older who work (not including those working from home) to compute the total percentage of walkers or bike commuters.
The Centers for Disease Control and Prevention tracks a multitude of health risk data for its Behavioral Risk Factor Surveillance System. Using the body mass index (BMI), it groups people into three classifications: obese (30 or greater BMI), overweight (25-29.9 BMI) or neither overweight nor obese (BMI less than 25). For this study, the variable measuring populations considered neither overweight nor obese in 2010 was used.
CDC’s 2010 dataset included estimates for 192 geographic areas. Some of these estimates, such as those for micropolitan statistical areas and metropolitan divisions, were not measured in the census data. A total of 126 metropolitan statistical areas had data from both surveys, and these were used for the analysis.
Methodology
Governing performed a multiple regression test, with the estimated percentage of an MSA’s population considered neither overweight nor obese used for the dependent variable. The percentage of walk/bike commuters was tested, along with five other independent variables: median household income, percent of population with a bachelor’s degree or higher, population density, unemployment and mean travel time to work. Data for all six variables was obtained from the 2010 American Communities Survey.
The regression test produced the following coefficients table:

Dependent variable = Percentage of residents neither obese nor overweight
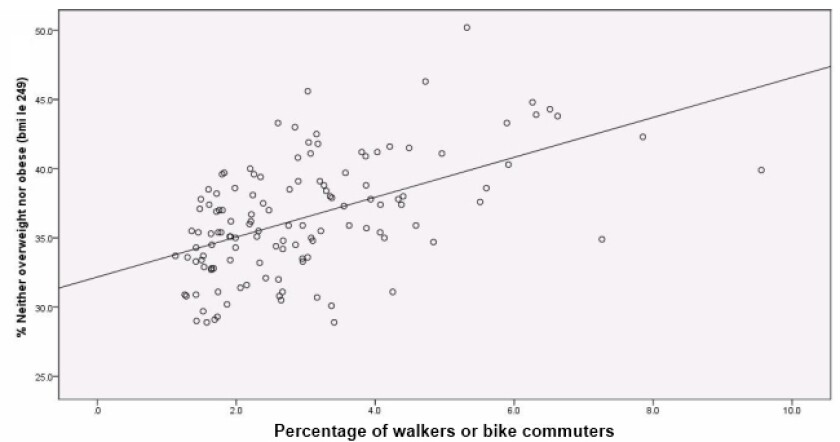
Correlations between healthy weight levels and those walking or biking to work, median household income and education were shown to be statistically significant at the .01 level. The education variable had the strongest effect on a population’s weight, followed by biking/walking to work and income.
A scatterplot illustrates the correlation between an MSA's percentages of walkers/bike commuters and those with healthy weights:
Data
The CDC’s Behavioral Risk Factor Surveillance System measures obesity and other health factors. The table below shows 2010 estimates for each geographic region surveyed, most of which are metro areas. Click here for a complete list of areas in included in the 2010 survey, along with specific counties comprising each area.
The following definitions describe the data:
- Healthy weight: Neither overweight nor obese
- Overweight: Body mass index of 25-29.9
- Obese: Body mass index of 30-99.8
- No physical activity: Respondents reporting doing no physical activity or exercise in past 30 days
| Area | Healthy Weight | Overweight | Obese | No Physical Activity |
|---|---|---|---|---|
| Atlantic City-NJ Metro Area | 30.7% | 42.5% | 26.8% | 27.8% |
| Austin-Round Rock-TX Metro Area | 35.9% | 37.1% | 27.0% | 19.3% |
| Bethesda-Gaithersburg-Frederick-MD Metro Division | 42.8% | 37.3% | 19.9% | 17.3% |
| Buffalo-Cheektowaga-Tonawanda-NY Metro Area | 37.9% | 37.5% | 24.7% | 23.9% |
| Charleston-North Charleston-SC Metro Area | 34.7% | 36.4% | 29.0% | 25.4% |
| Charlotte-Gastonia-Concord-NC-SC Metro Area | 37.0% | 35.0% | 28.0% | 22.6% |
| Chicago-Naperville-Joliet-IL-IN-WI Metro Area | 38.8% | 34.2% | 27.0% | 23.3% |
| Coeur d´Alene-ID Metro Area | 35.5% | 39.8% | 24.7% | 18.8% |
| Denver-Aurora-CO Metro Area | 43.0% | 37.4% | 19.6% | 16.2% |
| Durham-NC Metro Area | 41.1% | 32.4% | 26.6% | 22.0% |
| Edison-NJ Metro Division | 38.5% | 37.4% | 24.2% | 26.0% |
| Greenville-SC Metro Area | 32.1% | 33.9% | 34.0% | 26.5% |
| Hickory-Morganton-Lenoir-NC Metro Area | 33.4% | 41.7% | 25.0% | 30.2% |
| Kennewick-Richland-Pasco-WA Metro Area | 33.4% | 35.1% | 31.5% | 24.2% |
| Key West-Marathon-FL Micropolitan Area | 46.0% | 37.1% | 16.9% | 16.9% |
| Kingsport-Bristol-TN-VA Metro Area | 29.9% | 33.4% | 36.7% | 37.6% |
| Little Rock-North Little Rock-AR Metro Area | 29.3% | 36.0% | 34.6% | 23.8% |
| Louisville-KY-IN Metro Area | 33.7% | 35.1% | 31.2% | 25.2% |
| Miami-Fort Lauderdale-Miami Beach-FL Metro Area | 34.2% | 37.5% | 28.3% | 24.1% |
| Myrtle Beach-Conway-North Myrtle Beach-SC Metro Area | 32.2% | 41.2% | 26.6% | 22.7% |
| Nashville-Davidson--Murfreesboro-TN Metro Area | 37.8% | 37.4% | 24.7% | 26.7% |
| New Haven-Milford-CT Metro Area | 38.8% | 34.9% | 26.2% | 22.1% |
| New Orleans-Metairie-Kenner-LA Metro Area | 30.1% | 37.2% | 32.6% | 26.9% |
| New York-White Plains-Wayne-NY-NJ Metro Division | 40.5% | 37.6% | 21.9% | 24.6% |
| Newark-Union-NJ-PA Metro Division | 38.2% | 37.9% | 23.9% | 26.1% |
| Orlando-Kissimmee-FL Metro Area | 34.3% | 37.4% | 28.3% | 25.3% |
| Panama City-Lynn Haven-FL Metro Area | 34.1% | 37.9% | 28.0% | 23.9% |
| Peabody-MA | 41.0% | 36.7% | 22.3% | 19.6% |
| Phoenix-Mesa-Scottsdale-AZ Metro Area | 36.0% | 41.1% | 22.8% | 18.5% |
| Port St. Lucie-Fort Pierce-FL Metro Area | 35.5% | 36.5% | 28.0% | 22.1% |
| Portland-South Portland-Biddeford-ME Metro Area | 37.6% | 38.6% | 23.9% | 17.9% |
| Portland-Vancouver-Beaverton-OR-WA Metro Area | 40.3% | 33.7% | 26.0% | 15.8% |
| Sacramento—Arden-Arcade—Roseville-CA Metro Area | 40.9% | 35.1% | 24.0% | 15.3% |
| Salt Lake City-UT Metro Area | 41.8% | 34.6% | 23.6% | 18.3% |
| San Antonio-TX Metro Area | 36.7% | 33.5% | 29.8% | 26.5% |
| San Diego-Carlsbad-San Marcos-CA Metro Area | 41.2% | 32.8% | 26.1% | 19.0% |
| San Francisco-Oakland-Fremont-CA Metro Area | 44.8% | 36.9% | 18.2% | 17.4% |
| San Jose-Sunnyvale-Santa Clara-CA Metro Area | 39.7% | 39.1% | 21.2% | 17.0% |
| Santa Ana-Anaheim-Irvine-CA Metro Division | 43.1% | 36.3% | 20.7% | 21.1% |
| Santa Fe-NM Metro Area | 46.3% | 32.9% | 20.8% | 17.9% |
| Scottsbluff-NE Micropolitan Area | 27.9% | 39.1% | 33.0% | 27.5% |
| Scranton--Wilkes-Barre-PA Metro Area | 35.9% | 35.7% | 28.4% | 32.8% |
| Seaford-DE Micropolitan Area | 30.5% | 37.7% | 31.8% | 25.8% |
| Seattle-Bellevue-Everett-WA Metro Division | 42.3% | 34.9% | 22.8% | 16.6% |
| Sebring-FL Micropolitan Area | 35.5% | 35.0% | 29.4% | 28.9% |
| Shreveport-Bossier City-LA Metro Area | 33.2% | 36.3% | 30.4% | 34.1% |
| Sioux City-IA-NE-SD Metro Area | 32.6% | 35.7% | 31.7% | 28.2% |
| Sioux Falls-SD Metro Area | 33.3% | 39.9% | 26.8% | 21.4% |
| Spokane-WA Metro Area | 35.9% | 39.7% | 24.5% | 18.3% |
| Springfield-MA Metro Area | 41.2% | 35.0% | 23.8% | 20.5% |
| St. Louis-MO-IL Metro Area | 36.2% | 33.9% | 29.8% | 25.5% |
| Wichita Falls-TX Metro Area | 32.9% | 39.2% | 27.9% | 28.6% |
| Wichita-KS Metro Area | 38.5% | 34.4% | 27.1% | 22.6% |
| Akron-OH Metro Area | 38.2% | 32.5% | 29.3% | 22.6% |
| Albuquerque-NM Metro Area | 43.3% | 34.9% | 21.7% | 18.0% |
| Allentown-Bethlehem-Easton-PA-NJ Metro Area | 37.5% | 33.5% | 29.0% | 26.1% |
| Amarillo-TX Metro Area | 35.0% | 36.3% | 28.7% | 24.1% |
| Arcadia-FL Micropolitan Area | 32.2% | 33.7% | 34.1% | 35.1% |
| Asheville-NC Metro Area | 37.3% | 35.2% | 27.5% | 22.2% |
| Atlanta-Sandy Springs-Marietta-GA Metro Area | 37.4% | 33.9% | 28.7% | 22.1% |
| Augusta-Richmond County-GA-SC Metro Area | 31.1% | 36.8% | 32.1% | 25.9% |
| Augusta-Waterville-ME Micropolitan Area | 37.1% | 33.4% | 29.4% | 22.3% |
| Baltimore-Towson-MD Metro Area | 33.5% | 38.4% | 28.0% | 24.0% |
| Bangor-ME Metro Area | 31.1% | 35.4% | 33.5% | 24.1% |
| Barre-VT Micropolitan Area | 41.2% | 36.9% | 21.8% | 16.1% |
| Baton Rouge-LA Metro Area | 35.4% | 32.2% | 32.5% | 25.7% |
| Billings-MT Metro Area | 35.4% | 37.4% | 27.2% | 24.0% |
| Birmingham-Hoover-AL Metro Area | 33.7% | 37.0% | 29.3% | 29.2% |
| Bismarck-ND Metro Area | 39.4% | 36.1% | 24.5% | 19.4% |
| Boise City-Nampa-ID Metro Area | 38.0% | 36.6% | 25.3% | 16.6% |
| Boston-Quincy-MA Metro Division | 43.2% | 34.8% | 22.0% | 21.5% |
| Bremerton-Silverdale-WA Metro Area | 34.9% | 36.3% | 28.8% | 15.3% |
| Bridgeport-Stamford-Norwalk-CT Metro Area | 45.6% | 37.8% | 16.6% | 18.8% |
| Burlington-South Burlington-VT Metro Area | 42.3% | 36.0% | 21.7% | 13.6% |
| Cambridge-Newton-Framingham-MA Metro Division | 44.2% | 35.2% | 20.7% | 17.3% |
| Camden-NJ Metro Division | 34.7% | 35.8% | 29.5% | 27.2% |
| Canton-Massillon-OH Metro Area | 35.4% | 36.3% | 28.3% | 26.6% |
| Cape Coral-Fort Myers-FL Metro Area | 40.0% | 34.2% | 25.8% | 27.9% |
| Casper-WY Metro Area | 34.7% | 37.7% | 27.6% | 23.2% |
| Cedar Rapids-IA Metro Area | 41.1% | 33.5% | 25.4% | 25.5% |
| Charleston-WV Metro Area | 30.5% | 37.3% | 32.3% | 31.4% |
| Chattanooga-TN-GA Metro Area | 30.9% | 38.6% | 30.4% | 32.2% |
| Cheyenne-WY Metro Area | 33.8% | 39.2% | 27.0% | 23.1% |
| Cincinnati-Middletown-OH-KY-IN Metro Area | 38.1% | 34.4% | 27.4% | 25.4% |
| Cleveland-Elyria-Mentor-OH Metro Area | 34.4% | 40.9% | 24.7% | 22.7% |
| Colorado Springs-CO Metro Area | 38.6% | 37.8% | 23.6% | 19.1% |
| Columbia-SC Metro Area | 32.9% | 36.1% | 31.0% | 27.7% |
| Columbus-OH Metro Area | 34.5% | 35.0% | 30.5% | 26.3% |
| Concord-NH Micropolitan Area | 36.5% | 40.9% | 22.6% | 16.9% |
| Dallas-Plano-Irving-TX Metro Division | 36.4% | 29.8% | 33.8% | 26.4% |
| Dayton-OH Metro Area | 35.0% | 35.3% | 29.7% | 25.2% |
| Del Rio-TX Micropolitan Area | 25.8% | 32.9% | ||
| Deltona-Daytona Beach-Ormond Beach-FL Metro Area | 34.8% | 38.0% | 27.2% | 23.7% |
| Des Moines-West Des Moines-IA Metro Area | 35.1% | 38.9% | 26.0% | 22.3% |
| Detroit-Livonia-Dearborn-MI Metro Division | 32.9% | 34.0% | 33.1% | 28.3% |
| Dover-DE Metro Area | 29.4% | 38.8% | 31.9% | 30.4% |
| El Paso-TX Metro Area | 30.2% | 41.1% | 28.6% | 28.5% |
| Eugene-Springfield-OR Metro Area | 39.9% | 30.1% | 30.0% | 18.2% |
| Evansville-IN-KY Metro Area | 37.0% | 33.7% | 29.3% | 27.7% |
| Fargo-ND-MN Metro Area | 37.8% | 36.8% | 25.4% | 26.6% |
| Farmington-NM Metro Area | 35.0% | 31.4% | 33.7% | 22.9% |
| Fayetteville-Springdale-Rogers-AR-MO Metro Area | 38.5% | 37.1% | 24.4% | 26.2% |
| Fort Collins-Loveland-CO Metro Area | 50.2% | 28.5% | 21.3% | 13.1% |
| Fort Wayne-IN Metro Area | 30.9% | 36.0% | 33.2% | 23.4% |
| Fort Worth-Arlington-TX Metro Division | 30.3% | 34.4% | 35.3% | 24.0% |
| Gainesville-FL Metro Area | 43.8% | 36.0% | 20.1% | 19.1% |
| Grand Island-NE Micropolitan Area | 31.2% | 39.9% | 29.0% | 26.2% |
| Grand Rapids-Wyoming-MI Metro Area | 34.8% | 38.7% | 26.6% | 19.3% |
| Greensboro-High Point-NC Metro Area | 32.7% | 38.6% | 28.7% | 23.4% |
| Hagerstown-Martinsburg-MD-WV Metro Area | 34.3% | 33.6% | 32.1% | 27.7% |
| Hartford-West Hartford-East Hartford-CT Metro Area | 38.0% | 37.9% | 24.2% | 19.5% |
| Hastings-NE Micropolitan Area | 33.4% | 35.8% | 30.8% | 26.0% |
| Helena-MT Micropolitan Area | 39.3% | 39.6% | 21.1% | 18.4% |
| Hilo-HI Micropolitan Area | 39.4% | 33.9% | 26.8% | 19.2% |
| Hilton Head Island-Beaufort-SC Micropolitan Area | 40.2% | 37.5% | 22.4% | 19.0% |
| Homosassa Springs-FL Micropolitan Area | 38.3% | 38.0% | 23.7% | 22.7% |
| Honolulu-HI Metro Area | 43.9% | 34.2% | 21.9% | 19.7% |
| Houston-Sugar Land-Baytown-TX Metro Area | 36.9% | 34.0% | 29.1% | 23.6% |
| Huntington-Ashland-WV-KY-OH Metro Area | 30.6% | 35.8% | 33.5% | 30.2% |
| Idaho Falls-ID Metro Area | 35.9% | 35.8% | 28.3% | 19.4% |
| Indianapolis-Carmel-IN Metro Area | 36.2% | 35.7% | 28.2% | 23.5% |
| Jackson-MS Metro Area | 33.3% | 33.5% | 33.3% | 31.5% |
| Jacksonville-FL Metro Area | 38.6% | 35.4% | 26.0% | 27.9% |
| Kahului-Wailuku-HI Micropolitan Area | 37.1% | 35.9% | 27.0% | 16.4% |
| Kalispell-MT Micropolitan Area | 40.5% | 41.2% | 18.3% | 20.4% |
| Kansas City-MO-KS Metro Area | 34.5% | 36.0% | 29.5% | 23.0% |
| Kapaa-HI Micropolitan Area | 44.5% | 31.8% | 23.7% | 16.5% |
| Knoxville-TN Metro Area | 35.4% | 34.1% | 30.5% | 29.1% |
| Lake City-FL Micropolitan Area | 29.7% | 39.1% | 31.2% | 28.0% |
| Lakeland-Winter Haven-FL Metro Area | 29.0% | 33.0% | 37.9% | 26.0% |
| Laredo-TX Metro Area | 29.1% | 37.6% | 33.3% | 34.2% |
| Las Cruces-NM Metro Area | 32.0% | 37.2% | 30.8% | 24.5% |
| Las Vegas-Paradise-NV Metro Area | 39.6% | 37.3% | 23.1% | 23.7% |
| Lebanon-NH-VT Micropolitan Area | 40.2% | 34.6% | 25.2% | 19.6% |
| Lewiston-ID-WA Metro Area | 35.0% | 38.3% | 26.7% | 22.3% |
| Lewiston-Auburn-ME Metro Area | 38.2% | 34.9% | 26.9% | 24.3% |
| Lincoln-NE Metro Area | 37.4% | 32.5% | 30.1% | 18.2% |
| Los Angeles-Long Beach-Glendale-CA Metro Division | 37.5% | 38.2% | 24.3% | 20.8% |
| Lubbock-TX Metro Area | 35.3% | 32.5% | 32.2% | 30.7% |
| Manchester-Nashua-NH Metro Area | 39.7% | 35.8% | 24.5% | 18.7% |
| McAllen-Edinburg-Mission-TX Metro Area | 30.8% | 35.8% | 33.3% | 36.0% |
| Memphis-TN-MS-AR Metro Area | 28.9% | 35.3% | 35.8% | 26.1% |
| Midland-TX Metro Area | 38.5% | 37.6% | 23.9% | 33.3% |
| Milwaukee-Waukesha-West Allis-WI Metro Area | 39.1% | 35.0% | 26.0% | 24.4% |
| Minneapolis-St. Paul-Bloomington-MN-WI Metro Area | 38.4% | 36.7% | 24.9% | 17.1% |
| Minot-ND Micropolitan Area | 30.8% | 40.4% | 28.9% | 26.5% |
| Mobile-AL Metro Area | 32.8% | 33.6% | 33.6% | 30.3% |
| Naples-Marco Island-FL Metro Area | 40.8% | 36.4% | 22.9% | 13.6% |
| Nassau-Suffolk-NY Metro Division | 41.3% | 36.8% | 21.9% | 22.7% |
| Norfolk-NE Micropolitan Area | 29.0% | 38.4% | 32.5% | 28.3% |
| North Platte-NE Micropolitan Area | 33.2% | 34.6% | 32.2% | 28.8% |
| North Port-Bradenton-Sarasota-FL Metro Area | 41.9% | 36.4% | 21.6% | 21.6% |
| Ocala-FL Metro Area | 32.5% | 33.7% | 33.8% | 28.8% |
| Ocean City-NJ Metro Area | 37.0% | 37.6% | 25.4% | 24.9% |
| Ogden-Clearfield-UT Metro Area | 39.6% | 34.2% | 26.2% | 16.5% |
| Oklahoma City-OK Metro Area | 35.1% | 34.8% | 30.1% | 28.5% |
| Olympia-WA Metro Area | 41.5% | 33.7% | 24.8% | 15.2% |
| Omaha-Council Bluffs-NE-IA Metro Area | 37.0% | 37.2% | 25.8% | 23.7% |
| Palm Bay-Melbourne-Titusville-FL Metro Area | 31.4% | 37.4% | 31.3% | 26.4% |
| Pensacola-Ferry Pass-Brent-FL Metro Area | 35.5% | 35.0% | 29.6% | 25.5% |
| Philadelphia-PA Metro Division | 39.9% | 35.7% | 24.4% | 24.2% |
| Pittsburgh-PA Metro Area | 35.0% | 35.7% | 29.3% | 23.6% |
| Providence-New Bedford-Fall River-RI-MA Metro Area | 35.7% | 37.9% | 26.4% | 24.3% |
| Provo-Orem-UT Metro Area | 44.3% | 33.9% | 21.8% | 16.2% |
| Raleigh-Cary-NC Metro Area | 37.1% | 36.0% | 27.0% | 20.4% |
| Rapid City-SD Metro Area | 32.3% | 42.2% | 25.5% | 24.4% |
| Reno-Sparks-NV Metro Area | 42.5% | 36.8% | 20.7% | 19.1% |
| Richmond-VA Metro Area | 32.8% | 41.1% | 26.1% | 26.2% |
| Riverside-San Bernardino-Ontario-CA Metro Area | 35.1% | 36.4% | 28.5% | 23.6% |
| Rochester-NY Metro Area | 37.4% | 34.5% | 28.1% | 19.0% |
| Rockingham County-Strafford County-NH Metro Division | 37.1% | 36.1% | 26.8% | 19.5% |
| Rutland-VT Micropolitan Area | 36.2% | 33.3% | 30.5% | 22.6% |
| Tacoma-WA Metro Division | 32.3% | 36.5% | 31.2% | 19.6% |
| Tallahassee-FL Metro Area | 33.6% | 39.9% | 26.5% | 22.1% |
| Tampa-St. Petersburg-Clearwater-FL Metro Area | 35.5% | 38.2% | 26.3% | 22.1% |
| Toledo-OH Metro Area | 31.1% | 38.6% | 30.3% | 24.7% |
| Topeka-KS Metro Area | 28.9% | 35.0% | 36.1% | 22.3% |
| Trenton-Ewing-NJ Metro Area | 43.3% | 33.6% | 23.1% | 24.8% |
| Tucson-AZ Metro Area | 41.6% | 31.8% | 26.6% | 20.3% |
| Tulsa-OK Metro Area | 33.6% | 36.3% | 30.1% | 29.2% |
| Tuscaloosa-AL Metro Area | 30.8% | 38.0% | 31.2% | 31.0% |
| Twin Falls-ID Micropolitan Area | 35.7% | 33.2% | 31.1% | 25.4% |
| Tyler-TX Metro Area | 39.5% | 35.2% | 25.3% | 26.0% |
| Virginia Beach-Norfolk-Newport News-VA-NC Metro Area | 37.8% | 32.0% | 30.3% | 22.8% |
| Warren-Troy-Farmington Hills-MI Metro Division | 34.4% | 35.2% | 30.4% | 19.4% |
| Washington-Arlington-Alexandria-DC-VA-MD-WV Metro | 37.8% | 37.0% | 25.2% | 19.3% |
| Wauchula-FL Micropolitan Area | 17.6% | 40.6% | 41.8% | 27.2% |
| West Palm Beach-Boca Raton-Boynton Beach Metro Division | 39.9% | 40.1% | 20.0% | 22.6% |
| Wilmington-DE-MD-NJ Metro Division | 35.5% | 34.2% | 30.4% | 23.5% |
| Worcester-MA Metro Area | 39.1% | 35.8% | 25.2% | 19.0% |
| Yakima-WA Metro Area | 31.6% | 37.0% | 31.4% | 25.1% |
| Youngstown-Warren-Boardman-OH-PA Metro Area | 29.7% | 35.5% | 34.8% | 26.4% |
Alternative Means of Transportation Map
Governing compiled and analyzed 2010 American Community Survey estimates for means of transportation to work for metropolitan statistical areas. Separate data for more than 400 U.S. cities, towns and other census-designated places is shown on an interactive map. (Click to open map in new window).
