
We thought it would be instructive to look at this issue on a longer time horizon -- to go beyond the typical snapshot analysis -- so we spent some time diving into numbers from the Census Bureau and the Bureau of Labor Statistics for the period from 1998 to 2012.
Want more management news and commentary? Click here.
Our goal was to assess key trends in state and local government employment: What caused the recent job losses? Have government salaries kept up with the private sector? Did rising salaries or rising headcounts drive employee costs over the past decade and a half? Here is what we found:
Workforce reductions have come primarily through attrition, not people quitting or being laid off. States and local governments shed more than 1 million jobs in the aftermath of the recession. Many analysts have assumed this came from layoffs. This is not entirely true.
The quit-to-discharges ratio is used to calculate the ratio between those who leave their jobs voluntarily and those who are forced out. In 2009, this ratio was .81 for states and localities and .79 for the private sector, indicating that more people were being forced out of their jobs than were leaving voluntarily. By 2011, however, the state- and local-government quit-to-fire ratio stood at 1.10 compared to 1.14 in the private sector, indicating that more people were quitting than were being laid off.
Rather than layoffs, a failure to hire characterized the brunt of the total job losses in state and local government since 2009. The "hire-to-separation" rate, which must be above 1 for a sector to grow, was below 1 from 2009 to 2011 and just broke even in 2012, reaching 1.0061. This indicates that state- and local-government job losses were not disproportionately due to job losses but rather stemmed from significant non-hiring -- letting vacant positions remain vacant.
Rising salaries, not headcount, largely drove higher personnel costs. Pay raises may have been few and far between for state and local workers in recent years, but over the long haul they've more than held their own on the compensation front.
Since 1998, state and local workforces have grown almost as quickly as the underlying population (13 percent vs. 15 percent). However, state and local compensation has outstripped private-sector salaries, rising by 50 percent during the period as private-sector wages rose 33 percent. Much of this has to do with the increasingly higher level of education required of civil servants in a knowledge economy. In aggregate, these changes increased the base cost of state and local employees by 70 percent.
That 50 percent rise in state and local salaries was driven by across-the-board increases that were relatively even across government functions. Outside of hospitals, which showed an average salary increase of 72 percent, none of the major functions of state and local government nationwide showed increases that were more than 9 percent different from the overall average of 50 percent.
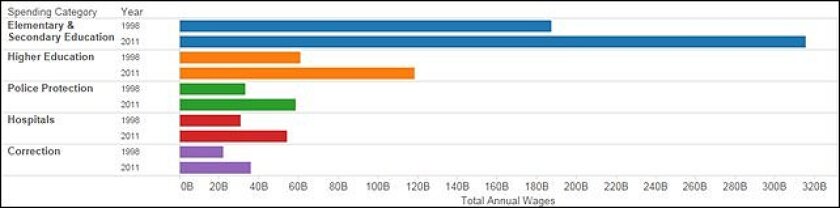
Education has dominated salary-spending growth. Elementary and secondary education dominates the total expenditures made by state and local governments as well as the growth in spending since 1998. Spending on salaries for K-12 is overwhelmingly local and grew from $188 billion in 1998 to $316 billion in 2011. During the same period, spending on salaries for public colleges and universities rose from $61 billion to $118 billion. These two education line items represented 53 percent of the total change in spending on state and local salaries between 1998 and 2011.
The graph below highlights the top five areas where spending increased:
The bottom line? State- and local-government personnel costs have increased over the past decade and a half primarily due to the rising per-capita cost of government employees, driven by across-the-board increases in salaries. More recently during the fiscal crisis, state and local governments have controlled their headcounts primarily through attrition rather than with the widespread layoffs we saw in the private sector.
That's the perspective of the past. Now, with government revenues on the upswing at the same time that states and localities face a wave of retirements among their baby-boomer workers along with other demographic challenges, governments are going to be making important decisions about the size, shape and cost of their workforces. It remains to be seen whether the past is prologue.
