

Today, his city of just over 50,000 outside of Raleigh now finds itself in the middle of a major construction boom. Last year, Apex issued construction permits for a record-high of more than 2,200 new housing units -- the highest per capita for any city of at least its size in the country.
It’s one of many mostly suburban cities adding new housing units at a rapid pace. To gauge where development is intensifying, Governing compiled the most recent residential construction permitting data reported to the Census Bureau for cities with populations exceeding 50,000. Overall, the numbers were similar to 2017 levels, with most still exceeding their historical averages.
The suburbs and exurbs in the hottest housing markets stand out with especially high permitting rates. In the Dallas-Fort Worth area, it’s the suburb of Frisco. East of Seattle, Redmond issued permits for 341 units per 10,000 population. Posting similar rates were Georgetown, Texas, just outside of Austin; and Buckeye, Ariz., near Phoenix.
This mirrors broader trends as Americans have increasingly migrated from urban to suburban areas.
For Apex, the steady expansion began decades ago. Then in 2015, Money magazine named the city the best place to live, leading even more people to move there.
“We have a desirable place to live, and we're watching the economy closely,” Mayor Olive says. “We’ve seen people come from pretty much everywhere.”
Along with a lot of families from the Northeast, the city has also welcomed many retirees relocating from Florida, know as “halfbacks.” Over the past two decades, the population of Apex has roughly tripled.
As in other places, though, all the development hasn’t come without growing pains.
The city hired additional housing staff to keep up with demand and to minimize a permitting backlog. Some builders, feeling pressure to move quickly, submit incomplete plans or request inspections before construction is complete. Olive says residents’ top concern has centered on all the additional traffic, so Apex officials are working with the state transportation department to widen and improve area roadways.
After Apex, the cities issuing permits for the most units per capita were Fort Myers, Fla., and Doral, Fla.
Cities Building the Most
| City | 2018 Units Per 10K | 2018 Units Permitted | Population |
|---|---|---|---|
| Apex, North Carolina | 444.2 | 2,241 | 50,451 |
| Fort Myers, Florida | 347.4 | 2,777 | 79,943 |
| Doral, Florida | 345.5 | 2,112 | 61,130 |
| Redmond, Washington | 341.1 | 2,193 | 64,291 |
| Georgetown, Texas | 322.3 | 2,278 | 70,685 |
| Buckeye, Arizona | 320.5 | 2,194 | 68,453 |
| Meridian, Idaho | 314.3 | 3,141 | 99,926 |
| Bonita Springs, Florida | 274.7 | 1,541 | 56,088 |
| Frisco, Texas | 271.2 | 4,808 | 177,286 |
| New Braunfels, Texas | 244.0 | 1,931 | 79,152 |
| Castle Rock, Colorado | 240.7 | 1,499 | 62,276 |
| Bowling Green, Kentucky | 232.0 | 1,556 | 67,067 |
| Lehi, Utah | 213.8 | 1,341 | 62,712 |
| Milpitas, California | 202.7 | 1,583 | 78,106 |
| Murfreesboro, Tennessee | 201.7 | 2,750 | 136,372 |
| McKinney, Texas | 193.2 | 3,503 | 181,330 |
| St. Cloud, Florida | 187.2 | 960 | 51,282 |
| Conroe, Texas | 185.0 | 1,561 | 84,378 |
| Bradenton, Florida | 181.2 | 1,024 | 56,508 |
| Goodyear, Arizona | 166.8 | 1,332 | 79,858 |
| Edinburg, Texas | 159.8 | 1,443 | 90,280 |
| South Jordan, Utah | 159.4 | 1,131 | 70,954 |
| Parker, Colorado | 159.2 | 863 | 54,202 |
| Brookhaven, Georgia | 157.9 | 845 | 53,518 |
| Greenville, South Carolina | 156.0 | 1,064 | 68,219 |
| Port St. Lucie, Florida | 155.4 | 2,943 | 189,344 |
| St. George, Utah | 155.1 | 1,309 | 84,405 |
| Grapevine, Texas | 146.3 | 790 | 53,982 |
| Ankeny, Iowa | 142.6 | 890 | 62,416 |
| Cape Coral, Florida | 141.8 | 2,601 | 183,365 |
| Austin, Texas | 139.7 | 13,283 | 950,715 |
| Commerce City, Colorado | 135.7 | 759 | 55,923 |
| Atlanta, Georgia | 133.6 | 6,496 | 486,290 |
| Reno, Nevada | 130.0 | 3,234 | 248,853 |
| Dublin, California | 129.0 | 786 | 60,939 |
| Mount Pleasant, South Carolina | 127.3 | 1,103 | 86,668 |
| Coeur d'Alene, Idaho | 127.1 | 644 | 50,665 |
| Champaign, Illinois | 126.6 | 1,107 | 87,432 |
| Henderson, Nevada | 125.0 | 3,783 | 302,539 |
| Franklin, Tennessee | 124.6 | 976 | 78,321 |
| Irvine, California | 122.9 | 3,410 | 277,453 |
| Rochester, Minnesota | 122.3 | 1,415 | 115,733 |
| Chapel Hill, North Carolina | 119.9 | 718 | 59,862 |
| Caldwell, Idaho | 118.0 | 645 | 54,660 |
| Nampa, Idaho | 116.4 | 1,089 | 93,590 |
| North Charleston, South Carolina | 115.5 | 1,280 | 110,861 |
| Broomfield, Colorado | 114.9 | 785 | 68,341 |
| Denton, Texas | 113.9 | 1,552 | 136,268 |
| Longmont, Colorado | 113.1 | 1,067 | 94,341 |
| Pflugerville, Texas | 113.0 | 716 | 63,359 |
| Bayonne, New Jersey | 112.7 | 757 | 67,186 |
| Sioux Falls, South Dakota | 112.0 | 1,981 | 176,888 |
| Denver, Colorado | 111.8 | 7,878 | 704,621 |
| Temple, Texas | 111.3 | 829 | 74,503 |
| Overland Park, Kansas | 110.4 | 2,111 | 191,278 |
| Sanford, Florida | 110.1 | 653 | 59,317 |
| Orlando, Florida | 109.9 | 3,079 | 280,257 |
| Seattle, Washington | 109.3 | 7,918 | 724,745 |
| St. Peters, Missouri | 108.1 | 618 | 57,178 |
| Menifee, California | 107.7 | 976 | 90,595 |
| Cedar Park, Texas | 107.1 | 811 | 75,704 |
| Fort Worth, Texas | 106.5 | 9,310 | 874,168 |
| Auburn, Alabama | 106.0 | 678 | 63,973 |
| Surprise, Arizona | 105.5 | 1,415 | 134,085 |
| Kissimmee, Florida | 105.3 | 749 | 71,104 |
| Palm Coast, Florida | 105.1 | 909 | 86,516 |
| Allen, Texas | 104.7 | 1,054 | 100,685 |
| Rowlett, Texas | 102.8 | 646 | 62,868 |
| Sarasota, Florida | 102.3 | 583 | 56,994 |
| Nashville, Tennessee | 102.3 | 6,828 | 667,560 |
| Richardson, Texas | 101.6 | 1,187 | 116,783 |
| Clovis, California | 100.9 | 1,107 | 109,691 |
| Folsom, California | 100.6 | 785 | 78,038 |
| Mansfield, Texas | 100.5 | 693 | 68,928 |
| Miami, Florida | 99.8 | 4,625 | 463,347 |
| Chino, California | 99.2 | 891 | 89,797 |
| Fargo, North Dakota | 98.9 | 1,210 | 122,359 |
| West Des Moines, Iowa | 98.3 | 645 | 65,608 |
| Lewisville, Texas | 98.1 | 1,040 | 106,021 |
| Warner Robins, Georgia | 97.8 | 732 | 74,854 |
| Woodbury, Minnesota | 97.8 | 682 | 69,756 |
| Bend, Oregon | 97.1 | 918 | 94,520 |
| Santa Rosa, California | 97.1 | 1,701 | 175,269 |
| Noblesville, Indiana | 96.5 | 597 | 61,882 |
| Tempe, Arizona | 95.2 | 1,761 | 185,038 |
| Apple Valley, Minnesota | 95.0 | 498 | 52,435 |
| Lakeville, Minnesota | 94.7 | 604 | 63,748 |
| Cary, North Carolina | 94.2 | 1,562 | 165,904 |
| Portland, Oregon | 92.3 | 5,979 | 647,805 |
| Jersey City, New Jersey | 92.0 | 2,491 | 270,753 |
| College Station, Texas | 90.8 | 1,031 | 113,564 |
| Oakland, California | 90.7 | 3,856 | 425,195 |
| Raleigh, North Carolina | 90.6 | 4,211 | 464,758 |
| Rocklin, California | 90.2 | 585 | 64,838 |
| Midland, Texas | 89.8 | 1,222 | 136,089 |
| Carrollton, Texas | 89.1 | 1,209 | 135,710 |
| Bryan, Texas | 87.5 | 735 | 84,021 |
| Minneapolis, Minnesota | 85.8 | 3,625 | 422,331 |
| Peoria, Arizona | 84.9 | 1,428 | 168,181 |
| Grand Prairie, Texas | 84.5 | 1,638 | 193,837 |
| Lake Charles, Louisiana | 84.4 | 651 | 77,117 |
| Fremont, California | 83.8 | 1,969 | 234,962 |
| Kennewick, Washington | 83.2 | 679 | 81,607 |
| Fayetteville, Arkansas | 82.2 | 701 | 85,257 |
| Carmel, Indiana | 82.1 | 757 | 92,198 |
| Bellingham, Washington | 80.6 | 718 | 89,045 |
| Round Rock, Texas | 79.9 | 988 | 123,678 |
| Jacksonville, Florida | 78.5 | 7,003 | 892,062 |
| Lake Havasu City, Arizona | 78.1 | 425 | 54,411 |
| Camarillo, California | 77.8 | 528 | 67,845 |
| Loveland, Colorado | 77.2 | 592 | 76,701 |
| Fishers, Indiana | 76.0 | 698 | 91,832 |
| North Las Vegas, Nevada | 75.7 | 1,840 | 242,975 |
| Ontario, California | 75.4 | 1,326 | 175,841 |
| Flower Mound, Texas | 75.0 | 575 | 76,681 |
| Valdosta, Georgia | 74.4 | 417 | 56,085 |
| Gilbert, Arizona | 73.8 | 1,789 | 242,354 |
| Lawrence, Kansas | 73.7 | 714 | 96,892 |
| Tulare, California | 73.0 | 466 | 63,855 |
| Blue Springs, Missouri | 72.6 | 399 | 54,945 |
| Alpharetta, Georgia | 72.2 | 475 | 65,799 |
| Southaven, Mississippi | 72.2 | 390 | 54,031 |
| Aurora, Colorado | 71.3 | 2,615 | 366,623 |
| Maple Grove, Minnesota | 70.4 | 500 | 71,066 |
| Boulder, Colorado | 69.7 | 747 | 107,125 |
| Thornton, Colorado | 69.4 | 951 | 136,978 |
| Tigard, Oregon | 69.2 | 368 | 53,148 |
| Edina, Minnesota | 69.1 | 359 | 51,958 |
| Suffolk, Virginia | 68.9 | 622 | 90,237 |
| Pearland, Texas | 68.2 | 818 | 119,940 |
| Gilroy, California | 67.8 | 391 | 57,664 |
| Huntsville, Alabama | 67.4 | 1,312 | 194,585 |
| Lenexa, Kansas | 67.2 | 360 | 53,553 |
| Washington, District of Columbia | 66.5 | 4,615 | 693,972 |
| Manteca, California | 66.1 | 524 | 79,268 |
| Ames, Iowa | 66.0 | 439 | 66,498 |
| Sparks, Nevada | 65.8 | 664 | 100,888 |
| Oak Park, Illinois | 65.6 | 343 | 52,261 |
| Billings, Montana | 65.5 | 718 | 109,642 |
| Las Cruces, New Mexico | 65.5 | 666 | 101,712 |
| Fort Collins, Colorado | 64.9 | 1,071 | 165,080 |
| Shoreline, Washington | 64.8 | 364 | 56,189 |
| Chula Vista, California | 64.7 | 1,751 | 270,471 |
| Bellevue, Washington | 64.0 | 924 | 144,444 |
| Eden Prairie, Minnesota | 63.5 | 409 | 64,400 |
| Vancouver, Washington | 63.4 | 1,114 | 175,673 |
| Missoula, Montana | 63.0 | 462 | 73,340 |
| Rapid City, South Dakota | 62.9 | 468 | 74,421 |
| Lubbock, Texas | 62.1 | 1,576 | 253,888 |
| Omaha, Nebraska | 61.8 | 2,887 | 466,893 |
| Lake Elsinore, California | 61.4 | 408 | 66,411 |
| Palm Bay, Florida | 61.3 | 684 | 111,657 |
| Clarksville, Tennessee | 61.2 | 938 | 153,205 |
| Layton, Utah | 61.0 | 468 | 76,691 |
| Mountain View, California | 60.8 | 495 | 81,438 |
| West Jordan, Utah | 60.4 | 688 | 113,905 |
| Killeen, Texas | 60.1 | 875 | 145,482 |
| Dallas, Texas | 60.0 | 8,047 | 1,341,075 |
| Roseville, California | 59.7 | 808 | 135,329 |
| Odessa, Texas | 59.2 | 692 | 116,861 |
| Moreno Valley, California | 59.2 | 1,226 | 207,226 |
| Richland, Washington | 58.9 | 331 | 56,243 |
| San Francisco, California | 58.6 | 5,178 | 884,363 |
| Summerville, South Carolina | 58.3 | 294 | 50,388 |
| McAllen, Texas | 57.9 | 826 | 142,696 |
| Houston, Texas | 57.2 | 13,237 | 2,312,717 |
| Cheyenne, Wyoming | 56.7 | 361 | 63,624 |
| Carson City, Nevada | 56.6 | 310 | 54,745 |
| Madison, Wisconsin | 56.5 | 1,443 | 255,214 |
| Lee's Summit, Missouri | 56.3 | 548 | 97,290 |
| Medford, Oregon | 55.8 | 456 | 81,780 |
| West Palm Beach, Florida | 55.7 | 614 | 110,222 |
| Orem, Utah | 55.7 | 545 | 97,839 |
| Greenwood, Indiana | 55.4 | 318 | 57,375 |
| Spokane Valley, Washington | 55.4 | 542 | 97,847 |
| Santa Clara, California | 55.2 | 702 | 127,134 |
| Millcreek, Utah | 55.2 | 332 | 60,192 |
| Pinellas Park, Florida | 54.7 | 289 | 52,854 |
| Winston-Salem, North Carolina | 54.6 | 1,335 | 244,605 |
| Edmond, Oklahoma | 53.0 | 487 | 91,950 |
| Boston, Massachusetts | 52.6 | 3,602 | 685,094 |
| Chandler, Arizona | 52.5 | 1,331 | 253,458 |
| Brentwood, California | 52.2 | 326 | 62,433 |
| Flagstaff, Arizona | 52.1 | 375 | 71,975 |
| Missouri City, Texas | 51.8 | 386 | 74,497 |
| Sunnyvale, California | 51.7 | 794 | 153,656 |
| Lakewood, Washington | 51.6 | 311 | 60,296 |
| Des Plaines, Illinois | 51.6 | 300 | 58,193 |
| Sandy Springs, Georgia | 51.2 | 546 | 106,739 |
| Lakewood, Colorado | 51.1 | 792 | 154,958 |
| Greeley, Colorado | 51.0 | 538 | 105,448 |
| Yuma, Arizona | 51.0 | 487 | 95,502 |
| Apopka, Florida | 50.8 | 262 | 51,564 |
| Salem, Oregon | 50.7 | 861 | 169,798 |
| Marysville, Washington | 50.1 | 345 | 68,864 |
| Eugene, Oregon | 49.4 | 834 | 168,916 |
| Homestead, Florida | 49.1 | 343 | 69,907 |
| Hendersonville, Tennessee | 49.0 | 282 | 57,517 |
| Mission, Texas | 48.7 | 411 | 84,424 |
| Tacoma, Washington | 48.4 | 1,033 | 213,418 |
| Chico, California | 48.1 | 449 | 93,293 |
| Oklahoma City, Oklahoma | 48.1 | 3,097 | 643,648 |
| Vista, California | 47.8 | 485 | 101,568 |
| Plymouth, Minnesota | 47.7 | 374 | 78,395 |
| Delano, California | 47.6 | 253 | 53,138 |
| Murrieta, California | 47.3 | 536 | 113,326 |
| Bossier City, Louisiana | 47.0 | 322 | 68,554 |
| Davis, California | 47.0 | 324 | 68,986 |
| Scottsdale, Arizona | 46.7 | 1,167 | 249,950 |
| Clearwater, Florida | 46.5 | 537 | 115,513 |
| Tampa, Florida | 46.4 | 1,788 | 385,430 |
| Sacramento, California | 46.3 | 2,324 | 501,901 |
| Joplin, Missouri | 46.1 | 241 | 52,288 |
| Idaho Falls, Idaho | 45.7 | 279 | 61,076 |
| Casa Grande, Arizona | 45.4 | 252 | 55,477 |
| Sammamish, Washington | 45.4 | 293 | 64,548 |
| Minnetonka, Minnesota | 45.2 | 240 | 53,085 |
| Pocatello, Idaho | 44.8 | 247 | 55,193 |
| Phoenix, Arizona | 44.7 | 7,262 | 1,626,078 |
| St. Charles, Missouri | 44.4 | 312 | 70,329 |
| Walnut Creek, California | 44.3 | 309 | 69,773 |
| Gastonia, North Carolina | 44.3 | 339 | 76,593 |
| Coon Rapids, Minnesota | 44.2 | 277 | 62,656 |
| Kansas City, Missouri | 44.1 | 2,154 | 488,943 |
| Waco, Texas | 43.6 | 595 | 136,436 |
| Visalia, California | 43.4 | 577 | 133,010 |
| Chesapeake, Virginia | 42.9 | 1,031 | 240,397 |
| Arvada, Colorado | 42.7 | 507 | 118,807 |
| Iowa City, Iowa | 42.3 | 321 | 75,798 |
| Grand Forks, North Dakota | 42.1 | 240 | 57,056 |
| Broken Arrow, Oklahoma | 42.0 | 455 | 108,303 |
| Columbus, Ohio | 42.0 | 3,693 | 879,170 |
| Bismarck, North Dakota | 42.0 | 306 | 72,865 |
| Albany, Oregon | 41.9 | 224 | 53,503 |
| Tyler, Texas | 41.6 | 437 | 104,991 |
| Owensboro, Kentucky | 41.6 | 247 | 59,404 |
| Woodland, California | 41.5 | 249 | 60,012 |
| Johnson City, Tennessee | 41.1 | 273 | 66,391 |
| Grand Rapids, Michigan | 40.9 | 814 | 198,829 |
| Los Angeles, California | 40.7 | 16,299 | 3,999,759 |
| Elk Grove, California | 40.3 | 693 | 171,844 |
| Lakeland, Florida | 40.3 | 435 | 108,054 |
| Blaine, Minnesota | 40.1 | 259 | 64,557 |
| Logan, Utah | 39.7 | 203 | 51,115 |
| Arlington, Texas | 39.5 | 1,566 | 396,394 |
| Provo, Utah | 38.9 | 457 | 117,335 |
| Naperville, Illinois | 38.7 | 572 | 147,682 |
| Hoboken, New Jersey | 38.6 | 213 | 55,131 |
| Ocala, Florida | 38.6 | 228 | 59,110 |
| St. Petersburg, Florida | 38.1 | 1,003 | 263,255 |
| Corvallis, Oregon | 37.4 | 217 | 57,961 |
| Pasadena, California | 36.7 | 524 | 142,647 |
| Chattanooga, Tennessee | 36.5 | 654 | 179,139 |
| Eau Claire, Wisconsin | 36.5 | 250 | 68,587 |
| Collierville, Tennessee | 36.4 | 183 | 50,286 |
| Galveston, Texas | 36.2 | 183 | 50,497 |
| O'Fallon, Missouri | 36.2 | 317 | 87,597 |
| Boynton Beach, Florida | 36.2 | 281 | 77,702 |
| Indio, California | 36.0 | 323 | 89,793 |
| Columbia, South Carolina | 35.8 | 477 | 133,114 |
| Dothan, Alabama | 35.8 | 244 | 68,202 |
| Cedar Rapids, Iowa | 35.7 | 472 | 132,228 |
| Kokomo, Indiana | 35.6 | 206 | 57,836 |
| Euless, Texas | 35.5 | 196 | 55,174 |
| Corona, California | 35.5 | 596 | 167,836 |
| Pembroke Pines, Florida | 35.3 | 602 | 170,712 |
| Livermore, California | 35.2 | 318 | 90,295 |
| New Haven, Connecticut | 35.1 | 460 | 131,014 |
| Richmond, California | 35.1 | 386 | 110,040 |
| Nashua, New Hampshire | 35.0 | 309 | 88,341 |
| Smyrna, Georgia | 34.9 | 198 | 56,685 |
| Hillsboro, Oregon | 34.6 | 370 | 106,894 |
| Pharr, Texas | 34.3 | 273 | 79,487 |
| Rock Hill, South Carolina | 34.2 | 250 | 73,068 |
| La Crosse, Wisconsin | 34.0 | 176 | 51,834 |
| Marietta, Georgia | 33.3 | 203 | 61,048 |
| North Richland Hills, Texas | 33.2 | 234 | 70,441 |
| San Antonio, Texas | 33.2 | 5,017 | 1,511,946 |
| Norman, Oklahoma | 33.1 | 407 | 122,843 |
| Moore, Oklahoma | 33.0 | 203 | 61,523 |
| Amarillo, Texas | 32.8 | 656 | 199,826 |
| Shawnee, Kansas | 32.8 | 215 | 65,513 |
| Santa Fe, New Mexico | 32.6 | 273 | 83,776 |
| Knoxville, Tennessee | 32.5 | 609 | 187,347 |
| El Paso, Texas | 32.3 | 2,209 | 683,577 |
| Port Orange, Florida | 32.1 | 203 | 63,203 |
| San Diego, California | 31.4 | 4,452 | 1,419,516 |
| Gresham, Oregon | 31.3 | 348 | 111,053 |
| Las Vegas, Nevada | 30.7 | 1,973 | 641,676 |
| Fort Smith, Arkansas | 30.6 | 269 | 88,037 |
| Pompano Beach, Florida | 30.4 | 336 | 110,473 |
| Deerfield Beach, Florida | 30.2 | 243 | 80,571 |
| Hesperia, California | 29.8 | 283 | 94,859 |
| Rancho Cordova, California | 29.5 | 217 | 73,563 |
| Chino Hills, California | 29.2 | 235 | 80,374 |
| South San Francisco, California | 29.2 | 197 | 67,429 |
| Greensboro, North Carolina | 29.2 | 846 | 290,222 |
| West Sacramento, California | 28.6 | 153 | 53,512 |
| Springdale, Arkansas | 28.5 | 227 | 79,599 |
| Bellevue, Nebraska | 28.3 | 151 | 53,424 |
| Lake Forest, California | 28.1 | 237 | 84,293 |
| Olympia, Washington | 28.1 | 145 | 51,609 |
| Plantation, Florida | 28.0 | 263 | 93,909 |
| Avondale, Arizona | 27.6 | 232 | 84,025 |
| Frederick, Maryland | 27.4 | 196 | 71,408 |
| San Jose, California | 27.4 | 2,836 | 1,035,317 |
| Savannah, Georgia | 27.2 | 399 | 146,444 |
| Madera, California | 27.2 | 178 | 65,508 |
| Santee, California | 27.0 | 157 | 58,113 |
| Fairfield, California | 27.0 | 314 | 116,266 |
| Weymouth Town, Massachusetts | 27.0 | 153 | 56,664 |
| Abilene, Texas | 26.8 | 327 | 121,885 |
| Deltona, Florida | 26.7 | 242 | 90,746 |
| San Marcos, California | 26.6 | 256 | 96,198 |
| Indianapolis, Indiana | 26.5 | 2,286 | 863,002 |
| Taylorsville, Utah | 26.3 | 158 | 59,992 |
| Des Moines, Iowa | 26.3 | 571 | 217,521 |
| Melbourne, Florida | 26.2 | 215 | 82,011 |
| San Angelo, Texas | 26.2 | 262 | 100,119 |
| DeSoto, Texas | 26.1 | 140 | 53,568 |
| El Monte, California | 25.7 | 298 | 116,109 |
| Yorba Linda, California | 25.6 | 175 | 68,229 |
| Springfield, Missouri | 25.6 | 429 | 167,376 |
| Renton, Washington | 25.5 | 259 | 101,379 |
| Springfield, Illinois | 25.5 | 293 | 114,868 |
| Burnsville, Minnesota | 25.4 | 156 | 61,439 |
| Baltimore, Maryland | 25.3 | 1,547 | 611,648 |
| Longview, Texas | 25.0 | 204 | 81,522 |
| Johns Creek, Georgia | 25.0 | 211 | 84,350 |
| Plano, Texas | 24.9 | 712 | 286,143 |
| Encinitas, California | 24.8 | 157 | 63,184 |
| Margate, Florida | 24.8 | 145 | 58,430 |
| Richmond, Virginia | 24.8 | 563 | 227,032 |
| Novi, Michigan | 24.6 | 147 | 59,715 |
| Yakima, Washington | 24.6 | 230 | 93,667 |
| Palm Desert, California | 24.4 | 129 | 52,932 |
| Norfolk, Virginia | 24.4 | 596 | 244,703 |
| New York, New York | 24.2 | 20,910 | 8,622,698 |
| Cincinnati, Ohio | 24.2 | 730 | 301,301 |
| Centennial, Colorado | 24.0 | 265 | 110,250 |
| High Point, North Carolina | 24.0 | 268 | 111,513 |
| Sandy, Utah | 23.9 | 230 | 96,145 |
| Everett, Washington | 23.8 | 262 | 110,079 |
| Beaumont, Texas | 23.8 | 283 | 119,114 |
| Little Rock, Arkansas | 23.7 | 470 | 198,606 |
| Springfield, Oregon | 23.6 | 147 | 62,353 |
| Fontana, California | 23.5 | 498 | 211,815 |
| Pensacola, Florida | 23.2 | 122 | 52,590 |
| Chicago, Illinois | 23.0 | 6,258 | 2,716,450 |
| Jackson, Tennessee | 22.9 | 153 | 66,847 |
| Irving, Texas | 22.9 | 550 | 240,373 |
| Carlsbad, California | 22.6 | 261 | 115,330 |
| Roswell, Georgia | 22.0 | 209 | 94,786 |
| Vacaville, California | 22.0 | 220 | 100,032 |
| Hollywood, Florida | 21.7 | 334 | 153,627 |
| San Ramon, California | 21.7 | 165 | 75,931 |
| Columbia, Missouri | 21.6 | 263 | 121,717 |
| Leesburg, Virginia | 21.6 | 117 | 54,215 |
| St. Louis, Missouri | 21.4 | 661 | 308,626 |
| Elyria, Ohio | 21.3 | 115 | 53,883 |
| Oceanside, California | 21.3 | 375 | 176,193 |
| Elizabeth, New Jersey | 21.1 | 275 | 130,215 |
| Newark, New Jersey | 20.9 | 597 | 285,154 |
| Somerville, Massachusetts | 20.9 | 170 | 81,360 |
| Riverside, California | 20.6 | 674 | 327,728 |
| Santa Clarita, California | 20.5 | 433 | 210,888 |
| North Little Rock, Arkansas | 20.5 | 135 | 65,911 |
| Rochester, New York | 20.4 | 424 | 208,046 |
| Paterson, New Jersey | 20.3 | 302 | 148,678 |
| Sterling Heights, Michigan | 20.3 | 269 | 132,631 |
| Tulsa, Oklahoma | 20.3 | 814 | 401,800 |
| Council Bluffs, Iowa | 19.7 | 123 | 62,316 |
| St. Paul, Minnesota | 19.5 | 597 | 306,621 |
| Kentwood, Michigan | 19.3 | 100 | 51,747 |
| Joliet, Illinois | 19.2 | 285 | 148,462 |
| Garland, Texas | 19.2 | 456 | 238,002 |
| Pomona, California | 19.1 | 292 | 152,939 |
| Gulfport, Mississippi | 19.1 | 137 | 71,822 |
| Fort Lauderdale, Florida | 18.8 | 339 | 180,072 |
| Pittsburg, California | 18.7 | 135 | 72,141 |
| Grand Island, Nebraska | 18.5 | 95 | 51,390 |
| Jupiter, Florida | 18.2 | 118 | 64,976 |
| White Plains, New York | 18.1 | 107 | 59,047 |
| Lorain, Ohio | 18.0 | 115 | 63,841 |
| Cathedral City, California | 18.0 | 98 | 54,596 |
| Plainfield, New Jersey | 17.9 | 92 | 51,327 |
| Hayward, California | 17.9 | 287 | 160,500 |
| Normal, Illinois | 17.5 | 95 | 54,284 |
| La Mesa, California | 17.5 | 105 | 60,021 |
| Methuen Town, Massachusetts | 17.3 | 87 | 50,259 |
| Virginia Beach, Virginia | 17.3 | 779 | 450,435 |
| Redondo Beach, California | 17.2 | 117 | 67,908 |
| Gardena, California | 17.1 | 103 | 60,224 |
| Lynchburg, Virginia | 17.0 | 138 | 80,995 |
| San Clemente, California | 16.9 | 110 | 65,267 |
| Rochester Hills, Michigan | 16.8 | 125 | 74,205 |
| Casper, Wyoming | 16.8 | 97 | 57,814 |
| Flint, Michigan | 16.7 | 161 | 96,448 |
| Carson, California | 16.5 | 153 | 92,735 |
| Palo Alto, California | 16.4 | 110 | 67,178 |
| Harrisonburg, Virginia | 16.2 | 88 | 54,215 |
| Anaheim, California | 16.2 | 571 | 352,497 |
| Westminster, Colorado | 16.1 | 182 | 112,812 |
| Berkeley, California | 15.9 | 195 | 122,324 |
| Sugar Land, Texas | 15.9 | 141 | 88,485 |
| San Buenaventura (Ventura), California | 15.6 | 173 | 110,790 |
| Brooklyn Park, Minnesota | 15.4 | 124 | 80,581 |
| West Valley City, Utah | 15.3 | 209 | 136,170 |
| Arcadia, California | 15.3 | 90 | 58,799 |
| Shreveport, Louisiana | 15.2 | 291 | 192,036 |
| Baton Rouge, Louisiana | 15.1 | 340 | 225,374 |
| Colton, California | 15.0 | 82 | 54,828 |
| Danbury, Connecticut | 14.8 | 126 | 85,246 |
| Westminster, California | 14.5 | 133 | 91,564 |
| Portsmouth, Virginia | 14.5 | 137 | 94,572 |
| Costa Mesa, California | 14.4 | 164 | 113,825 |
| Escondido, California | 14.3 | 218 | 151,969 |
| Porterville, California | 13.9 | 82 | 59,145 |
| Boca Raton, Florida | 13.9 | 136 | 98,150 |
| Hoffman Estates, Illinois | 13.8 | 71 | 51,567 |
| Bartlett, Tennessee | 13.7 | 81 | 59,102 |
| Janesville, Wisconsin | 13.7 | 88 | 64,359 |
| Rockville, Maryland | 13.5 | 92 | 68,401 |
| Manhattan, Kansas | 13.1 | 72 | 54,832 |
| Haverhill, Massachusetts | 13.0 | 83 | 63,639 |
| Miramar, Florida | 13.0 | 183 | 140,328 |
| Independence, Missouri | 12.9 | 151 | 117,306 |
| Redlands, California | 12.9 | 92 | 71,554 |
| Beaverton, Oregon | 12.8 | 125 | 97,514 |
| Rialto, California | 12.6 | 130 | 103,562 |
| Montgomery, Alabama | 12.1 | 241 | 199,518 |
| Arlington Heights, Illinois | 11.8 | 89 | 75,634 |
| Dubuque, Iowa | 11.7 | 68 | 58,276 |
| Portland, Maine | 11.7 | 78 | 66,882 |
| Kansas City, Kansas | 11.6 | 178 | 152,938 |
| Hialeah, Florida | 11.6 | 278 | 239,673 |
| New Britain, Connecticut | 11.6 | 84 | 72,710 |
| Terre Haute, Indiana | 11.5 | 70 | 60,774 |
| Fayetteville, North Carolina | 11.5 | 241 | 209,889 |
| Union City, California | 11.4 | 86 | 75,343 |
| Redding, California | 11.2 | 103 | 91,794 |
| Novato, California | 11.1 | 62 | 55,980 |
| Great Falls, Montana | 11.0 | 65 | 58,876 |
| Hamilton, Ohio | 11.0 | 68 | 62,092 |
| Delray Beach, Florida | 10.9 | 75 | 68,749 |
| Antioch, California | 10.8 | 121 | 111,674 |
| Apple Valley, California | 10.8 | 79 | 73,077 |
| Decatur, Alabama | 10.7 | 58 | 54,405 |
| Cupertino, California | 10.5 | 64 | 60,777 |
| Stockton, California | 10.4 | 324 | 310,496 |
| Rancho Cucamonga, California | 10.4 | 185 | 177,452 |
| Ann Arbor, Michigan | 10.4 | 126 | 121,477 |
| Salinas, California | 10.3 | 163 | 157,596 |
| Baldwin Park, California | 10.3 | 79 | 76,402 |
| El Cajon, California | 9.7 | 101 | 103,894 |
| Camden, New Jersey | 9.7 | 72 | 74,532 |
| Bloomington, Illinois | 9.6 | 75 | 77,934 |
| Green Bay, Wisconsin | 9.6 | 101 | 105,116 |
| Lancaster, California | 9.5 | 153 | 160,316 |
| Glendora, California | 9.5 | 50 | 52,445 |
| Stamford, Connecticut | 9.5 | 124 | 130,824 |
| Kenner, Louisiana | 9.3 | 63 | 67,451 |
| Aliso Viejo, California | 9.3 | 48 | 51,671 |
| Largo, Florida | 9.2 | 78 | 84,754 |
| Port Arthur, Texas | 8.8 | 49 | 55,498 |
| Syracuse, New York | 8.8 | 126 | 143,396 |
| Enid, Oklahoma | 8.6 | 43 | 50,122 |
| Pasadena, Texas | 8.4 | 129 | 153,520 |
| Appleton, Wisconsin | 8.3 | 62 | 74,653 |
| Wellington, Florida | 8.0 | 52 | 64,848 |
| Burien, Washington | 7.9 | 41 | 51,671 |
| San Mateo, California | 7.9 | 83 | 104,748 |
| Temecula, California | 7.9 | 90 | 114,327 |
| Garden Grove, California | 7.9 | 137 | 174,226 |
| Ogden, Utah | 7.8 | 68 | 87,031 |
| Warwick, Rhode Island | 7.8 | 63 | 80,871 |
| Glendale, Arizona | 7.7 | 191 | 246,709 |
| Hemet, California | 7.4 | 63 | 85,160 |
| Milwaukee, Wisconsin | 7.4 | 439 | 595,351 |
| Glendale, California | 7.1 | 144 | 203,054 |
| Auburn, Washington | 7.1 | 57 | 80,776 |
| Huntington Beach, California | 7.0 | 142 | 201,874 |
| Alexandria, Virginia | 7.0 | 112 | 160,035 |
| Newport News, Virginia | 6.9 | 124 | 179,388 |
| Coral Gables, Florida | 6.8 | 35 | 51,095 |
| Federal Way, Washington | 6.7 | 65 | 96,690 |
| Davenport, Iowa | 6.6 | 68 | 102,320 |
| Mobile, Alabama | 6.6 | 126 | 190,265 |
| Brockton, Massachusetts | 6.6 | 63 | 95,672 |
| Bellflower, California | 6.6 | 51 | 77,772 |
| Paramount, California | 6.6 | 36 | 54,909 |
| Topeka, Kansas | 6.5 | 82 | 126,587 |
| Bristol, Connecticut | 6.5 | 39 | 60,223 |
| Eagan, Minnesota | 6.5 | 43 | 66,627 |
| Livonia, Michigan | 6.2 | 58 | 94,105 |
| Warren, Michigan | 6.1 | 82 | 135,022 |
| Aurora, Illinois | 6.0 | 121 | 200,965 |
| Evansville, Indiana | 6.0 | 71 | 118,930 |
| Fullerton, California | 5.7 | 80 | 140,392 |
| Oshkosh, Wisconsin | 5.6 | 37 | 66,665 |
| Oxnard, California | 5.5 | 115 | 210,037 |
| Peabody, Massachusetts | 5.5 | 29 | 52,987 |
| Diamond Bar, California | 5.5 | 31 | 56,665 |
| La Habra, California | 5.3 | 33 | 62,466 |
| Newton, Massachusetts | 5.3 | 47 | 88,994 |
| Weston, Florida | 5.2 | 37 | 70,944 |
| Union City, New Jersey | 5.1 | 36 | 70,387 |
| New Bedford, Massachusetts | 4.9 | 47 | 95,120 |
| Orland Park, Illinois | 4.9 | 29 | 58,765 |
| Mesquite, Texas | 4.9 | 70 | 143,949 |
| Tinley Park, Illinois | 4.8 | 27 | 56,668 |
| Lowell, Massachusetts | 4.5 | 50 | 111,346 |
| Erie, Pennsylvania | 4.4 | 43 | 97,369 |
| Long Beach, California | 4.3 | 201 | 469,450 |
| Lawton, Oklahoma | 4.3 | 40 | 93,714 |
| Rockford, Illinois | 4.2 | 62 | 147,051 |
| St. Clair Shores, Michigan | 4.2 | 25 | 59,635 |
| Vallejo, California | 4.2 | 51 | 122,105 |
| Palmdale, California | 4.1 | 65 | 157,519 |
| Wheaton, Illinois | 4.1 | 22 | 53,373 |
| Buena Park, California | 4.1 | 34 | 83,015 |
| Muncie, Indiana | 4.1 | 28 | 68,625 |
| Alhambra, California | 4.0 | 34 | 85,396 |
| San Bernardino, California | 4.0 | 86 | 216,995 |
| Lakewood, California | 4.0 | 32 | 80,967 |
| Wyoming, Michigan | 4.0 | 30 | 75,938 |
| Alameda, California | 3.9 | 31 | 79,177 |
| Medford, Massachusetts | 3.8 | 22 | 57,797 |
| Springfield, Ohio | 3.7 | 22 | 59,208 |
| Bridgeport, Connecticut | 3.7 | 54 | 146,579 |
| Miami Beach, Florida | 3.4 | 31 | 92,307 |
| Gaithersburg, Maryland | 3.3 | 23 | 68,710 |
| Kenosha, Wisconsin | 3.3 | 33 | 99,877 |
| Monterey Park, California | 3.3 | 20 | 61,044 |
| Norwalk, Connecticut | 3.3 | 29 | 89,005 |
| Farmington Hills, Michigan | 3.2 | 26 | 81,050 |
| Jacksonville, North Carolina | 3.2 | 23 | 72,447 |
| Dearborn, Michigan | 3.1 | 29 | 94,491 |
| Torrance, California | 3.0 | 44 | 146,758 |
| Daly City, California | 3.0 | 32 | 107,074 |
| South Gate, California | 2.9 | 28 | 95,430 |
| Bolingbrook, Illinois | 2.9 | 22 | 75,201 |
| Poway, California | 2.8 | 14 | 50,041 |
| Peoria, Illinois | 2.7 | 31 | 112,883 |
| Coconut Creek, Florida | 2.6 | 16 | 61,010 |
| Detroit, Michigan | 2.5 | 170 | 673,104 |
| Coral Springs, Florida | 2.5 | 33 | 133,037 |
| Trenton, New Jersey | 2.4 | 20 | 84,964 |
| Skokie, Illinois | 2.2 | 14 | 63,978 |
| Berwyn, Illinois | 2.2 | 12 | 55,550 |
| Orange, California | 2.1 | 30 | 140,560 |
| Pawtucket, Rhode Island | 2.1 | 15 | 72,001 |
| Southfield, Michigan | 2.0 | 15 | 73,208 |
| Waukegan, Illinois | 1.9 | 17 | 87,729 |
| Whittier, California | 1.8 | 16 | 86,838 |
| Waterbury, Connecticut | 1.8 | 20 | 108,629 |
| Fountain Valley, California | 1.8 | 10 | 56,313 |
| Mission Viejo, California | 1.7 | 16 | 96,016 |
| Burbank, California | 1.6 | 17 | 104,834 |
| Evanston, Illinois | 1.6 | 12 | 74,756 |
| Palatine, Illinois | 1.6 | 11 | 68,644 |
| Lakewood, Ohio | 1.6 | 8 | 50,249 |
| Concord, California | 1.5 | 20 | 129,783 |
| Miami Gardens, Florida | 1.4 | 16 | 113,750 |
| Jackson, Mississippi | 1.3 | 21 | 166,965 |
| Norwalk, California | 1.0 | 11 | 106,084 |
| West Covina, California | 0.8 | 9 | 107,598 |
| Bloomington, Minnesota | 0.8 | 7 | 85,866 |
| Mount Prospect, Illinois | 0.7 | 4 | 53,930 |
| Oak Lawn, Illinois | 0.7 | 4 | 56,087 |
| Pontiac, Michigan | 0.7 | 4 | 59,792 |
| Racine, Wisconsin | 0.6 | 5 | 77,542 |
| Parma, Ohio | 0.6 | 5 | 79,167 |
| Schaumburg, Illinois | 0.5 | 4 | 74,184 |
| Schenectady, New York | 0.3 | 2 | 65,625 |
| San Leandro, California | 0.2 | 2 | 90,553 |
| Huntington Park, California | 0.2 | 1 | 58,822 |
| Decatur, Illinois | 0.1 | 1 | 72,174 |
| Providence, Rhode Island | 0.1 | 2 | 180,393 |
| Cerritos, California | 0.0 | 0 | 51,020 |
| Hempstead, New York | 0.0 | 0 | 55,806 |
| Sunrise, Florida | 0.0 | 0 | 94,323 |
SOURCE: Governing calculations of U.S. Census Bureau Building Permits Survey data for December 2018
Among larger cities -- those with populations of at least 300,000 -- Austin’s rate last year topped all others, followed closely by Atlanta and Reno, Nev.
Generally speaking, it’s the southern cities and parts of the West Coast where growth remains the strongest. This, of course, mirrors broader national trends as these same regions are adding jobs and population at a faster pace than other parts of the country.
One Sun Belt city that’s experienced exponential growth for the past few years is Frisco, Texas. Its per capita rate last year was the highest of any city with a population over 100,000. The area continues to lure major employers in a range of industries, including Keurig Dr. Pepper, which announced last month that it plans to move its Texas headquarters there.
John Lettelleir, the city’s development services director, estimated that about 65 percent to 70 percent of the city has now been developed or has plans for development. To encourage more density, the city no longer allows for garden-style apartment zoning, instead favoring mixed-use development.
While the bulk of the largest construction growth is taking place in the Sun Belt and the West, there are exceptions.
Ankeny, Iowa, a fast-growing city of 62,000 outside of Des Moines, issued permits for about 900 units, most of them single-family residences. Rochester, Minn., with a population of 116,000, reported permits for more than 1,400 new units. Several college towns, including Bowling Green, Ky., and Champaign, Ill., also recorded strong gains in multi-unit housing.
By comparison, Sunrise, Fla., a city of about 95,000 bordering the Everglades, and Cerritos, Calf., didn’t issue a single residential construction permit last year. Cities with the lowest permitting rates tend to be either suburbs like these that are fairly built out or economically depressed areas of the Midwest. A few such cities have routinely issued permits for fewer than a dozen new units a year.
Much more than housing demand dictates the amount of construction activity taking place.
Some cities are left with little room to develop, while those in Texas and other lower-density areas maintain plenty of available land. But that doesn’t mean that cities can’t build up: Even San Francisco has been ramping up permitting in recent years, recording about 5,200 new units last year.
In other jurisdictions, local zoning ordinances and political opposition effectively hinder development year after year. It’s an issue that’s been the subject of much debate in California, where the state is pressuring cities to comply with a housing supply law. Gov. Gavin Newsom’s administration recently sued the city of Huntington Beach for failure to meet requirements, sending a message to 46 other cities that it considers out of compliance.
“I don’t intend to file suit against all 47, but I’m not going to preside over neglect and denial,” Newsom said in his State of the State address last month.
Many of the California cities the state has singled out for noncompliance issued relatively few permits last year. Huntington Park, Calif., has approved just one new unit over the past two years. Paramount, a similar-sized city of about 55,000, issued permits for 36 units last year and only 13 the year before, Census data show.
How 2018 Construction Rates Compare Over Time
In about 62 percent of the cities reviewed, 2018 permitting totals exceeded their averages over the prior 10-year period. All of the largest cities over a half million exceeded their averages with the exceptions of Detroit, El Paso and Milwaukee. (Some others, however, don’t report data to the Census Bureau.)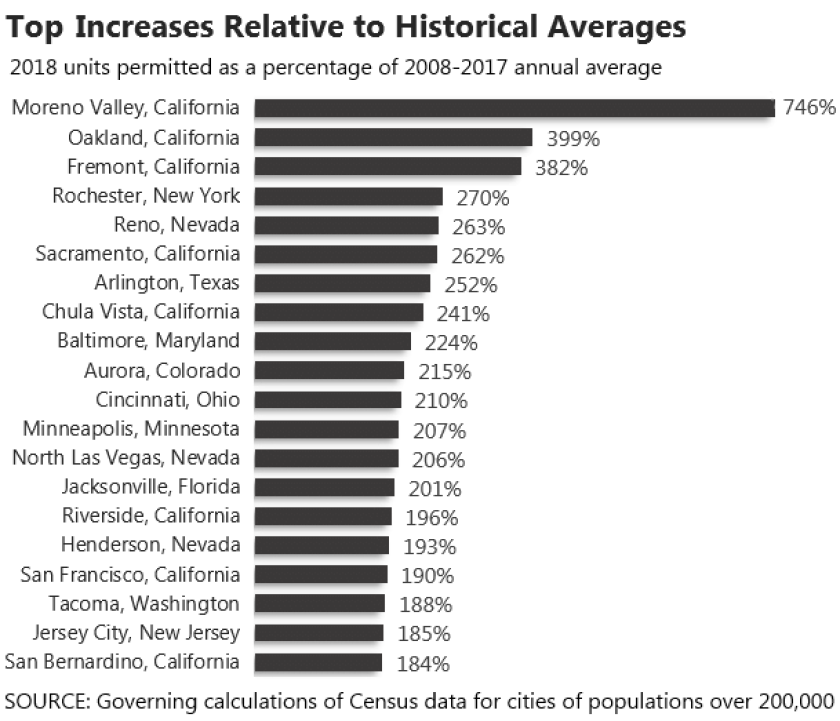
Many of the cities with the strongest gains relative to their historical averages are found in California, with particularly sharp growth continuing in the San Francisco Bay Area. For the second consecutive year, Oakland issued permits for about 3,900 units -- approximately four times the city’s annual average. Nearby Fremont similarly reported nearly 2,000 units after generally permitting fewer than 500 annually in recent years. Smaller cities, including San Ramon and Richmond, also reported totals far above their averages. Elsewhere, Moreno Valley and Santa Rosa, Calif., saw their permitting totals spike last year.
Nationally, 135 of the 582 cities over 50,000 reviewed recorded numbers of permitted units that more than doubled their historical averages.