
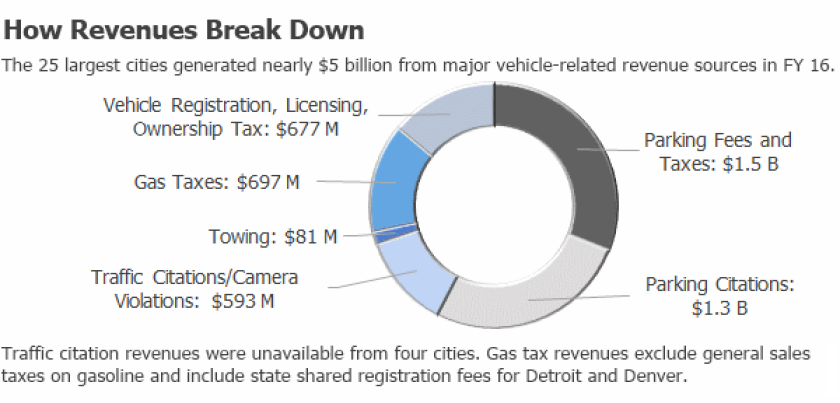
In all, cities took in a total of nearly $5 billion in fiscal year 2016 from parking-related activities, camera and traffic citations, gas taxes, towing, vehicle registration and licensing fees. That amounts to about $129 per capita for all 25 jurisdictions. The reported data, however, suggests the introduction of self-driving cars could have drastically different effects, with some cities experiencing far greater potential reductions in revenues than others.
Cities with the highest reported revenues on a per capita basis included San Francisco ($512), Washington, D.C. ($502), and Chicago ($248). New York and Chicago derive more revenue from parking fines than from parking fee collections. Chicago, Los Angeles, New York, Philadelphia, San Francisco, Seattle and Washington, D.C., all assess special parking taxes. Other jurisdictions registered somewhat higher totals because they levy local taxes on gasoline or vehicle personal property taxes.
Elsewhere, cities don't generate as much automobile-related revenues. It's possible some large jurisdictions could lose little to no money if significant cost savings from reduced enforcement occur and additional revenue streams from new developments that replace parking facilities materialize. Cities with the lowest revenues were Dallas, El Paso, Jacksonville and San Antonio, each reporting less than $25 million.
Some of the variation stems from differences in how states share revenues with their localities. Phoenix, for instance, received approximately $176 million in highway user tax and vehicle licensing fees from the state government. By contrast, Texas shares little to no revenues with its cities. The District of Columbia’s total was among the highest of those surveyed, in part because the District does not share gasoline and vehicle revenues with any state.
Parking collection fees and fines accounted for more than half the total revenues cities reported. The 25 cities also reported receiving about $700 million in gasoline taxes.
Still, the $5 billion total understates all sources of revenues tied to vehicle usage. Reported revenue totals do not include general sales taxes on gasoline or parking as these totals were generally unavailable from cities. They also don't include taxes on new vehicle purchases, which can be substantial. Los Angeles received approximately $42 million in sales taxes from vehicle purchases last year, for example. Most cities surveyed also reported minor revenues from residential parking permits, but such programs are typically revenue neutral. Additionally, our data does not include taxes and fees on car rentals and ride hailing companies, but these are unlikely to be limited by autonomous vehicles.
Smaller Jurisdictions Most Reliant on Vehicle Revenues
The local governments most likely to incur the biggest revenue hits are smaller jurisdictions that rely significantly on parking or traffic enforcement revenues to fund their budgets. Separately, we reviewed financial data that a national sample of general-purpose local governments reported for the Census Bureau’s 2014 Annual Survey of State and Local Government Finances.Two types of surveyed revenues were parking revenues and those collected from violations of laws, such as civil penalties, court fees and forfeits of deposits. These two limited revenue categories accounted for more than 10 percent of general revenues in 74 mostly smaller jurisdictions reviewed. The city of Bella Villa, Mo., reported the highest share of these revenues (59 percent), followed by Quitman, Ark. (52 percent). Several resort towns largely dependent on parking to fund government operations also reported higher totals.
Jurisdictions with large budgets should be able to absorb any revenue reductions. But individual city agencies or special purpose districts could be hit much harder if they rely directly on parking or other revenue streams not routed to general funds. These include transportation departments and convention center authorities in some cities.
Data for Large Cities
Figures shown for the 25 most populated cities represent fiscal year 2016 revenues for all areas of cities’ budgets.- Per Capita Rate: Calculated per capita total revenues for all revenue categories using 2016 population estimates published by the U.S. Census Bureau.
- Parking: Revenue collected from meters, lots and facilities. Also includes parking taxes levied in select cities and shared revenues from private operators. Excludes residential permit fees.
- Parking Fines: All fines and related revenues from parking violations.
- Traffic Citations: Traffic citation revenues were typically reported by local courts or police.
- Traffic Enforcement Cameras: Citations paid from traffic and red light cameras operating in some cities. Any revenues paid to camera vendors are subtracted unless noted.
- Towing: Towing, storage fees and contracts. Program expenses are not excluded.
- Gas Taxes: Locally-administered motor fuel taxes and shared revenues from states. Does not include general sales taxes.
- Motorist Licensing: Amounts include both licensing fees and vehicle registration where shared revenues from states are not reported separately.
- Registration/Ownership Taxes: State and locally administered vehicle registration fees and vehicle property taxes where available.
| City | Per Capita Rate | Total Revenues | Parking | Parking Fines | Traffic Citations | Traffic Camera | Towing | Gas Taxes | Licensing | Registration/ Ownership Taxes |
|---|---|---|---|---|---|---|---|---|---|---|
| Austin | >$39.0 | >$36.6 | $11.8 | $4.0 | $18.9 | $0.8 | Unavailable | $0 | $0 | $1.0 |
| Boston | $218.2 | $146.9 | $17.4 | $58.9 | $1.7 | $0 | $1.3 | $0 | $0 | $67.6 |
| Charlotte | >$85.4 | >$71.9 | $1.1 | $0.9 | Unavailable | $0 | $0.1 | $20.4 | $0 | $49.4 |
| Chicago | >$248.2 | >$671.3 | $145.0 | $162.5 | Unavailable | $101.2 | $14.7 | $117.4 | $0 | $130.5 |
| Columbus | >$61.3 | >$52.7 | $6.4 | $6.6 | Unavailable | Unavailable | $0.0 | $24.6 | $15.1 | $0 |
| Dallas | >$13.5 | >$17.8 | $6.8 | $2.8 | $8.0 | Unavailable | Unavailable | $0 | $0 | $0.1 |
| Denver | $184.3 | $127.7 | $22.6 | $30.6 | $9.9 | $0.6 | $2.1 | $28.6 | $5.3 | $28.1 |
| Detroit | $152.0 | $102.3 | $13.2 | $11.7 | $17.8 | $0 | $1.4 | $58.1 | $0 | $0 |
| El Paso | $25.5 | $17.4 | $1.3 | $2.1 | $13.5 | $0.5 | $0 | $0 | $0 | $0.1 |
| Fort Worth | $36.2 | $30.9 | $7.8 | $1.5 | $11.0 | $8.9 | $1.7 | $0 | $0 | $0.0 |
| Houston | >$14.6 | >$33.6 | $8.9 | $10.9 | $13.8 | $0 | $0 | $0 | $0 | Unavailable |
| Indianapolis | >$96.3 | >$82.4 | $2.7 | Included in parking | Unavailable | $0 | $0.3 | $51.6 | $27.8 | $0 |
| Jacksonville | $21.9 | $19.3 | $3.0 | $1.1 | $4.1 | $1.1 | $0 | $6.0 | $4.0 | $0 |
| Los Angeles | $111.0 | $441.5 | $190.1 | $148.0 | $5.1 | $0.0 | $12.2 | $84.5 | $1.6 | $0 |
| Memphis | $71.9 | $47.0 | $0.9 | $1.1 | $12.6 | $2.3 | $0 | $17.8 | $0 | $12.2 |
| Nashville | $87.3 | $57.6 | $6.0 | $0.6 | $2.5 | $0 | $0 | $19.7 | $0 | $28.8 |
| New York | $137.7 | $1,176.0 | $392.7 | $545.4 | $23.8 | $96.3 | $24.2 | $0 | $0 | $93.7 |
| Philadelphia | $210.0 | $329.2 | $181.6 | $83.0 | $6.0 | $15.1 | $5.5 | $38.0 | $0 | $0 |
| Phoenix | $168.1 | $271.5 | $86.3 | $0.9 | $4.9 | $0.9 | $2.0 | $116.7 | $59.8 | $0 |
| San Antonio | $14.0 | $20.8 | $9.5 | $2.0 | $5.5 | $0 | $3.7 | $0 | $0 | $0.2 |
| San Diego | $57.0 | $80.2 | $13.1 | $32.1 | $4.7 | $0 | $0 | $29.6 | $0.6 | $0 |
| San Francisco | $511.7 | $445.6 | $234.0 | $88.2 | $8.6 | $1.3 | $10.0 | $23.0 | $78.1 | $2.3 |
| San Jose | $55.9 | $57.4 | $16.4 | $11.4 | $1.0 | $0 | $1.1 | $21.0 | $0.4 | $6.1 |
| Seattle | $232.9 | $164.1 | $80.5 | $20.8 | $2.2 | $14.1 | $0.7 | $14.3 | $31.4 | $0.0 |
| Washington, D.C. | $501.7 | $341.8 | $41.0 | $68.3 | $3.2 | $170.9 | $0.4 | $25.3 | $4.4 | $28.3 |
Some figures are preliminary. The four California cities collectively received approximately $800 million in additional property tax revenues in lieu of vehicle licensing fees from the state (not shown). Changes in vehicle registrations should not affect these revenues using the state’s current funding formula, however, as it applies changes in assessed valuation of real estate property rather than vehicle registrations to a base figure established in fiscal 2004-2005.
Notes and sources for individual cities
Austin: All citation and red light camera revenues are gross revenues. The city received $983,403 in Child Safety Fund revenues, recorded as vehicle registration fees.
Sources: City Budget Office, Austin Transportation Department, City Controller’s Office, Austin Municipal Court
Boston: The city’s registration revenues refer to $67.7 million in motor vehicle excise fees, which were somewhat higher than prior annual totals as a result of bills being sent out late in 2015.
Sources: Mayor's office, Office of Budget Management
Charlotte: Vehicle registration revenues include registration fees and approximately $31 million in property tax revenues. Some figures are preliminary. Excludes airport operating fund.
Sources: City Manager’s Office
Chicago: Gasoline tax revenues are preliminary totals. The $130.5 million vehicle registration/ownership amount listed refers to the city’s wheel tax. Chicago also receives a portion of court violation fines and fees from the state and county, but the city was unable to determine what amount was received specifically from traffic violations.
Sources: Office of Management and Budget, 2016 Annual Financial Analysis
Columbus: Sources: Department of Management and Finance, Department of Public Service
Dallas: The city received $97,115 in child safety vehicle registration fees from the state government.
Sources: Office of Financial Services, Department of Court and Detention Services, Convention and Event Services Department
Denver: Gas tax revenues refer to $28.6 million in Highway Users Tax Fund revenue from the state, which includes shared gasoline taxes, licensing fees and vehicle registration fees. The city received $5.3 million in locally-administered licensing fees and $28.1 million from a locally-administered ownership tax.
Sources: Denver Public Works, Department of Finance
Detroit: The city’s gas tax revenues shown include all shared vehicle-related revenues from the state.
Sources: Detroit Municipal Parking Department, Michigan 36th District Court, FY 2016 Comprehensive Annual Financial Report
El Paso: Revenue for the city’s Red Light Fund for FY16 was 1,202,977; net revenue after expenses was $463,636.
Sources: Office of the City Attorney, Office of Management and Budget
Fort Worth: Red light fines do not include program costs. Towing fees reflect forecasted FY 2016 revenues reported for the police department for impoundment fees, vehicle towing and storage fees.
Sources: Transportation and Public Works Department, City of Fort Worth Municipal Court, FY 2017 Adopted Annual Budget
Houston: The city collects personal property taxes on motor vehicles, but totals were not available.
Sources: City’s Controller’s Office, Municipal Courts Department, Administration and Regulatory Affairs
Indianapolis: A private company, ParkIndy, manages the city's parking meter collection and enforcement. A portion of its collection and fine revenues are shared with the city, reflected in the parking amount. State shared revenues from license and registration fees are reflected in the licensing amount.
Source: Office of Finance and Management
Jacksonville: The city’s licensing revenues represent all DMV transactions, as reported by the Duval County Tax Collector. The city reported only $6,045 in towing fees.
Sources: City of Jacksonville, Duval County Clerk of Courts, Jacksonville Sheriff's Office, Duval County Tax Collector
Los Angeles: The city’s parking total includes $110 million in parking tax revenues. Towing fees include impound, vehicle release and franchise fees. The city reported $1.6 million in general fund revenue from excess motor vehicle licensing fees from the state. California cities also receive additional property tax revenues (not shown) in lieu of motor vehicle licensing fees from the state. Changes in vehicle registrations should not affect these revenues using the state’s current funding formula, however, as it applies changes in assessed valuation of real estate property rather than vehicle registrations to a base figure established in fiscal 2004-2005.
Sources: Los Angeles Police Department, Office of the City Administrative Officer, Department of Transportation
Memphis: Sources: City of Memphis Finance Division, FY 2016 Comprehensive Annual Financial Report
Nashville: Sources: Nashville Public Works, Circuit Court Clerk’s Office, Office of Management and Budget
New York City: Traffic camera violation totals are gross revenues with program costs not subtracted. Registration/ownership fees reflect an auto use tax and commercial motor vehicle tax. Parking total includes $178.4 million in parking taxes the city received in sales tax year 2016, which does not correspond with the city's fiscal year.
Sources: FY 2016 Comprehensive Annual Financial Report (CAFR), Financial Management System (FMS), NYC Comptroller, New York State Department of Taxation and Finance
Philadelphia: Parking total includes $92.7 million in parking taxes. Gas tax revenues represent totals from the County Liquid Fuels Tax and the Special Gas Tax. The city received approximately $21 million in traffic camera revenues and paid $5.9 million in vendor fees.
Sources: City of Philadelphia, Philadelphia Parking Authority
Phoenix: Parking revenues include meter revenues, airport parking, one parking garage operated by the public works department and five convention center garages. Traffic camera revenues do not exclude any expenses or costs incurred by the police department. Registration total does not include vehicle use taxes levied for vehicles purchased.
Sources: Finance Department, Police Department, PMC Financial Management Division Photo Enforcement Report, Aviation Department, Public Works Department, Streets Transportation Department, Phoenix Municipal Court, FY 2016 Comprehensive Annual Financial Report (CAFR)
San Antonio: Parking and traffic citation revenues include Child Safety Fund revenues. Parking collections include $100,108 in parking permit revenue.
Source: Office of Management and Budget
San Diego: The city received $122.3 million in additional property tax revenues (not shown) in lieu of motor vehicle licensing fees from the state. Changes in vehicle registrations should not affect these revenues using the state’s current funding formula, however, as it applies changes in assessed valuation of real estate property rather than vehicle registrations to a base figure established in fiscal 2004-2005. San Diego also receives revenues from towing, but they're canceled out by operating costs.
Sources: City Communications Department, San Diego County Superior Court of California
San Francisco: Parking, parking fines, towing fees and traffic camera revenues represent fiscal 2015 totals; fiscal 2016 figures were not available from SFMTA. Any amounts distributed to vendors are not subtracted from camera revenues. The City and County of San Francisco received $2.3 million through the San Francisco County Transportation Authority’s local vehicle tax, recorded as registration/ownership revenues. It received $77.5 million in state vehicle license fees and $620,000 in motor vehicle in lieu fees, shown as licensing revenue. The government also received more than $200 million in additional property tax revenues (not shown) in lieu of motor vehicle licensing fees from the state. Changes in vehicle registrations should not affect these revenues using the state’s current funding formula, however, as it applies changes in assessed valuation of real estate property rather than vehicle registrations to a base figure established in fiscal 2004-2005.
Sources: Office of the Controller, San Francisco County Superior Court, San Francisco Municipal Transportation Agency, FY 2016 Comprehensive Annual Financial Report (CAFR)
San Jose: For vehicle registration, the Department of Transportation received funding from the state through Measure B totaling $6,166,144. For licensing revenues, the city received $40,000 in motor vehicle in-lieu excess fees. San Jose also received additional property tax revenues (not shown) in lieu of motor vehicle licensing fees from the state. Changes in vehicle registrations should not affect these revenues using the state’s current funding formula, however, as it applies changes in assessed valuation of real estate property rather than vehicle registrations to a base figure established in fiscal 2004-2005.
Sources: City Department of Transportation, Department of Planning, Building and Code Enforcement, Santa Clara County Superior Court
Seattle: Parking total includes $40.3 million in commercial parking tax revenues. For traffic camera revenues, vendor and city operating costs of $4.17 million were subtracted from $18.3 million in reported enforcement revenues.
Source: City Budget Office
Washington, DC: Motor vehicle registration amount does not include excise taxes assessed at purchase. Traffic camera amount does not account for program costs. D.C. levies a parking tax, but all proceeds are distributed to the Washington Metropolitan Area Transit Authority.
Sources: Department of Motor Vehicles, Department of Transportation, FY 2018 Proposed Budget and Financial Plan