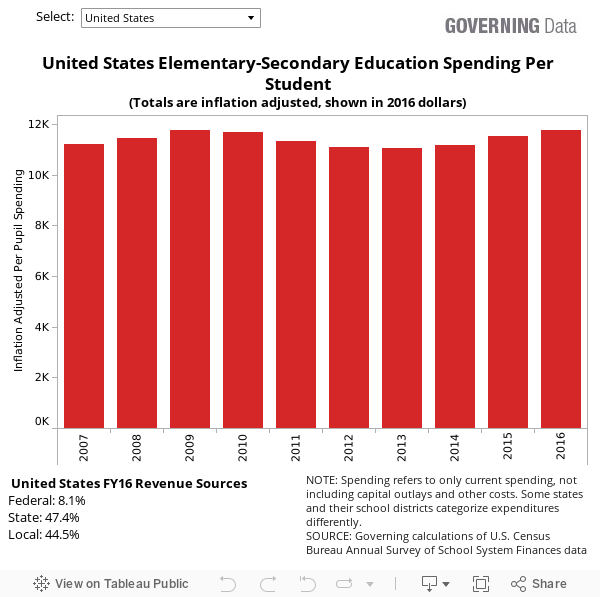
Nationally, the most recent data indicates $11,762 is spent on public education per student. Significant variation exists across states; New York spends more than $20,000 per student, while states like Utah and Idaho report spending about a third as much.
(NOTE: See the most recent data for the 2018 fiscal year)
Many different factors and conditions within states influence education spending totals. Some of the more prominent factors include cost of living, class sizes and student demographics.
Expenditures shown in the following table reflect current spending, which does not include capital outlays, interest on debts and payments to other governments.
2016 Public School Spending Per Student By State
| State | Total Per Pupil Spending | Total Spending (in Ks) | Instruction Spending Per Pupil | Instruction Spending (in Ks) | Support Services Per Pupil | Support Services (in Ks) |
|---|---|---|---|---|---|---|
| United States | $11,762 | $587,004,677 | $7,160 | $357,578,738 | $4,107 | $199,467,318 |
| Alabama | $9,236 | $6,907,539 | $5,257 | $3,865,453 | $3,321 | $2,439,634 |
| Alaska | $17,510 | $2,327,151 | $9,449 | $1,251,738 | $7,427 | $983,877 |
| Arizona | $7,613 | $7,276,067 | $4,077 | $3,872,250 | $3,105 | $2,913,176 |
| Arkansas | $9,846 | $4,750,938 | $5,539 | $2,658,253 | $3,762 | $1,802,769 |
| California | $11,495 | $72,641,244 | $6,849 | $42,587,272 | $4,191 | $26,058,021 |
| Colorado | $9,575 | $8,519,780 | $5,423 | $4,786,838 | $3,785 | $3,333,043 |
| Connecticut | $18,958 | $9,798,789 | $11,656 | $6,110,631 | $6,621 | $3,307,162 |
| Delaware | $14,713 | $1,845,143 | $9,191 | $1,126,775 | $4,852 | $588,181 |
| District of Columbia | $19,159 | $1,007,280 | $10,758 | $594,396 | $7,637 | $369,131 |
| Florida | $8,920 | $25,339,845 | $5,478 | $15,212,112 | $2,984 | $8,286,140 |
| Georgia | $9,769 | $17,118,329 | $5,975 | $10,534,931 | $3,216 | $5,554,271 |
| Hawaii | $13,748 | $2,516,444 | $8,066 | $1,468,044 | $4,953 | $901,508 |
| Idaho | $7,157 | $1,971,800 | $4,262 | $1,171,313 | $2,508 | $689,190 |
| Illinois | $14,180 | $29,223,830 | $8,636 | $17,804,976 | $5,134 | $10,426,170 |
| Indiana | $9,856 | $9,959,771 | $5,706 | $5,730,602 | $3,653 | $3,663,349 |
| Iowa | $11,150 | $5,694,316 | $6,787 | $3,447,707 | $3,894 | $1,978,260 |
| Kansas | $9,960 | $4,941,714 | $6,063 | $3,006,786 | $3,401 | $1,685,306 |
| Kentucky | $9,863 | $6,834,081 | $5,708 | $3,917,968 | $3,533 | $2,425,472 |
| Louisiana | $11,038 | $7,305,990 | $6,199 | $4,095,916 | $4,222 | $2,789,031 |
| Maine | $13,278 | $2,491,632 | $7,587 | $1,437,164 | $5,216 | $938,187 |
| Maryland | $14,206 | $12,516,025 | $8,848 | $7,779,504 | $4,935 | $4,338,868 |
| Massachusetts | $15,593 | $15,466,496 | $9,713 | $9,991,819 | $5,396 | $4,970,289 |
| Michigan | $11,668 | $15,860,412 | $6,823 | $9,113,469 | $4,416 | $5,899,097 |
| Minnesota | $12,382 | $10,520,027 | $8,074 | $6,548,885 | $3,719 | $3,016,934 |
| Mississippi | $8,702 | $4,246,156 | $4,951 | $2,407,637 | $3,190 | $1,551,274 |
| Missouri | $10,313 | $9,417,531 | $6,156 | $5,488,433 | $3,700 | $3,298,811 |
| Montana | $11,348 | $1,657,624 | $6,701 | $973,199 | $4,125 | $599,074 |
| Nebraska | $12,299 | $3,882,657 | $8,008 | $2,526,973 | $3,642 | $1,149,107 |
| Nevada | $8,960 | $3,978,436 | $5,183 | $2,288,790 | $3,409 | $1,505,591 |
| New Hampshire | $15,340 | $2,778,905 | $9,610 | $1,743,022 | $5,341 | $959,654 |
| New Jersey | $18,402 | $26,756,822 | $10,716 | $15,831,343 | $6,999 | $9,549,742 |
| New Mexico | $9,693 | $3,102,120 | $5,418 | $1,733,158 | $3,789 | $1,212,080 |
| New York | $22,366 | $61,447,337 | $15,746 | $43,964,520 | $6,130 | $15,883,500 |
| North Carolina | $8,792 | $12,917,195 | $5,513 | $8,060,544 | $2,806 | $4,102,549 |
| North Dakota | $13,373 | $1,460,308 | $8,005 | $867,650 | $4,380 | $474,679 |
| Ohio | $12,102 | $20,561,122 | $7,071 | $12,247,509 | $4,613 | $7,357,292 |
| Oklahoma | $8,097 | $5,474,468 | $4,528 | $3,047,217 | $2,989 | $2,011,100 |
| Oregon | $10,842 | $6,457,713 | $6,327 | $3,834,741 | $4,123 | $2,367,410 |
| Pennsylvania | $15,418 | $26,261,079 | $9,446 | $16,717,308 | $5,383 | $8,464,573 |
| Rhode Island | $15,532 | $2,242,317 | $9,035 | $1,340,088 | $6,065 | $811,796 |
| South Carolina | $10,249 | $7,746,894 | $5,629 | $4,274,682 | $4,054 | $3,013,294 |
| South Dakota | $9,176 | $1,248,905 | $5,360 | $730,176 | $3,287 | $440,580 |
| Tennessee | $8,810 | $8,886,616 | $5,406 | $5,401,812 | $2,917 | $2,915,193 |
| Texas | $9,016 | $45,886,733 | $5,514 | $27,862,199 | $3,002 | $15,169,007 |
| Utah | $6,953 | $4,095,444 | $4,467 | $2,591,600 | $2,098 | $1,217,100 |
| Vermont | $17,873 | $1,652,676 | $10,720 | $1,013,209 | $6,629 | $583,178 |
| Virginia | $11,432 | $14,752,819 | $6,966 | $8,944,614 | $4,024 | $5,164,699 |
| Washington | $11,534 | $12,569,546 | $6,538 | $7,087,365 | $4,525 | $4,904,575 |
| West Virginia | $11,291 | $3,167,977 | $6,507 | $1,804,235 | $4,073 | $1,127,255 |
| Wisconsin | $11,456 | $9,959,870 | $6,697 | $5,760,418 | $4,304 | $3,691,439 |
| Wyoming | $16,442 | $1,560,764 | $9,750 | $921,494 | $6,197 | $585,700 |
Fiscal Year 2016 Public Elementary-Secondary School Per Pupil Spending By Function
For most states, instructional employees typically account for slightly more than half of total education spending per student. Support staff and administrative expenses also account for varying expenses. This chart illustrates how major components of education spending per student vary by state. (Also see FY 2015 chart or FY 2014 chart.)Historical State School Spending Data
Select a state in the menu below to view reported education revenues and expenditures by state since 2007: