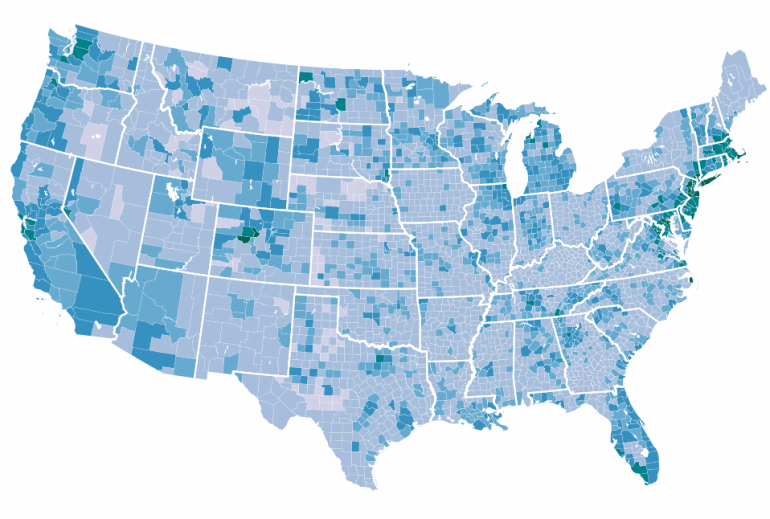
Broadband adoption data reported to the Federal Communication Commission tallied about 72 million fixed residential connections with download speeds of at least 3 megabits per second and upload speeds of at least 768 kilobits per second at the end of 2013. That’s fast enough to stream videos, but still not enough for most video conferencing and some other online applications.
Nationwide, there were about 60 fixed broadband Internet connections meeting the threshold per every 100 households. Hawaii recorded the highest broadband adoption rate, followed by New Jersey and Massachusetts. Broadband adoption is lower in regions of the South and Great Plains.
The following map shows ranges for U.S. county broadband adoption rates reported to the FCC, current as of Dec. 31, 2013. Fixed residential connections meeting the aforementioned speed requirements are included with the exception of terrestrial mobile wireless Internet.
Click a county to display its adoption data. Please pan the map to view Alaska and Hawaii.
Fixed Residential Broadband Connections per 1,000 Households
|
|
|
|
|
|
|
| 0 | 1-200 | 201-400 | 401-600 | 601-800 | More than 800 |


