

Perceptions of police loom as a key consideration as agencies look to strengthen ties with communities and, in many areas, consider body-worn cameras and other new technology. A recent survey by Accenture, a management consulting and technology firm, attempted to answer questions assessing citizens’ expectations for police and how agencies can improve.
The vast majority of the 2,000 adults surveyed indicated they felt safe in their communities, but 76 percent still reported room for improvement. The survey, conducted in late 2014, was limited to 14 of the nation’s larger metro areas; the results are not representative of the country as a whole.
Community policing-related efforts preferred
Accenture asked respondents to identify steps police could take to be more effective. While no response received a majority of votes, results suggest community policing efforts enjoy particularly strong support. Lower scores for technology-related improvements may have resulted from citizens’ unfamiliarity of how tools work and their potential benefits, according to the report.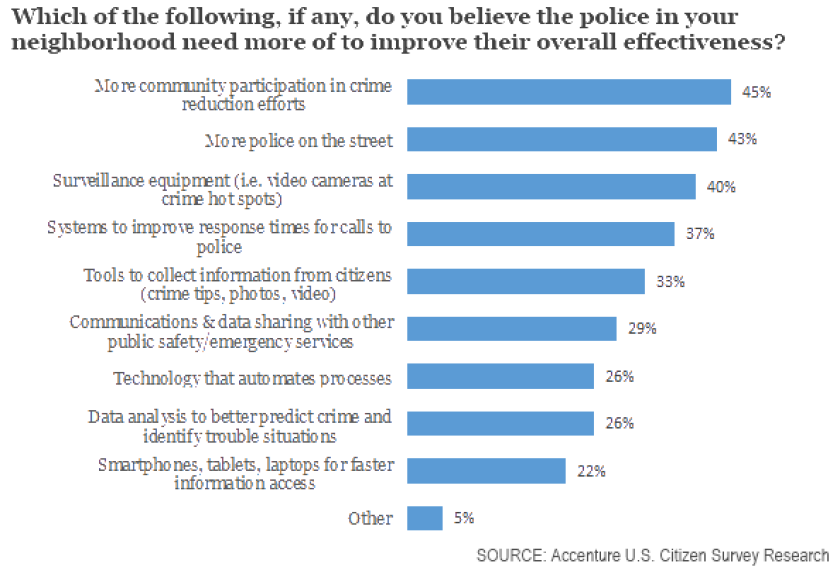
Young adults more wary of police technology
Younger adults tend to be more tech savvy than those nearing retirement. But the survey results suggest it's older Americans who are more accepting of newer tools and technology police departments are deploying. While the majority of all age groups surveyed said both in-car and body cameras were “very acceptable,” both had strong support from roughly three-quarters of residents age 55 and older.Respondents expressed similar views across all age groups on more controversial tools like military-grade weapons and drones. Sixty percent of all respondents reported military-grade weapons were “somewhat” or “very” acceptable (about a third said they were “very” acceptable), while 57 percent thought the same of drones.
QUESTION: In your opinion, how acceptable are each of the following for use by the police in your neighborhood?
Options: very acceptable, somewhat acceptable, not very acceptable, not at all acceptable. Results shown for those responding "very acceptable."
| Technology/Tool | Age 18-34 | Age 35-54 | Age 55+ |
|---|---|---|---|
| In-car cameras | 61% | 74% | 77% |
| Wearable cameras (worn by officers) | 56% | 67% | 73% |
| Protective body armor | 56% | 66% | 74% |
| Wearable computers & "smartwatches" | 47% | 58% | 60% |
| Satellite location / mapping technologies | 47% | 56% | 61% |
| Neighborhood cameras | 43% | 46% | 49% |
| Military-grade weapons/vehicles (for serious threat/disaster) | 32% | 36% | 35% |
| Drones (to view specific area) | 25% | 27% | 26% |
Where there’s room for improvement
The vast majority of those surveyed (85 percent) indicated they were either “very” or “somewhat” satisfied with police services. Still, most residents identified at least one area in need of improvement. Reducing crime and partnering with residents, by a slight margin, were the top two identified factors needing at least some improvement.The survey also found that respondents living in cities were more likely (87 percent) to indicate police agencies had room for improvement than those living in suburbs (68 percent).

(Results not shown for those responding "don't know.")
Citizens report they’re willing to collaborate
The Accenture survey further attempted to gauge residents’ preferences for collaborating with police. Results suggest the majority of residents are open to working with police but are most likely to do so anonymously. Many larger departments allow citizens to submit anonymous tips on websites, phone apps or via text messaging.A fairly large share of residents also expressed interest in community-policing related activities, such as neighborhood watch programs.

Suggestions vary across age groups
An open-ended survey question asking about suggested improvements yielded major differences across age groups. Overall, older residents favored technology upgrades, while others expressed more support for community-related initiatives.Question: If you could speak with your police chief to suggest one thing you feel would improve police services in your neighborhood, what would you say?
NOTE: Percentages refer to the proportion of each age group making a suggestion. Responses were grouped into categories; some respondents' suggestions fell into more than one category.
| Suggestion | Base | Age 18-34 | Age 35-54 | Age 55+ |
|---|---|---|---|---|
| Community relations; listen to residents, get to know each other better | 30% | 79% | 6% | 7% |
| More technology / more cameras / website/ other ways to let us know what is going on in our neighborhood | 26% | 8% | 7% | 64% |
| Neighborhood watch / facilitate crime reporting -- get the community more involved in reporting crime, provide alternative ways to report crime | 23% | 4% | 56% | 4% |
| Better attitudes / more respect / friendlier & more polite officers | 22% | 4% | 54% | 3% |
| More police visibility -- more patrolling /foot patrols | 32% | 43% | 26% | 28% |
| More communication | 15% | 2% | 2% | 44% |