

Older, more established communities, especially in the Northeast and the industrial Midwest, tend to possess more legacy wealth and established institutions, so they generally have far more nonprofits than more newly developed regions do, although the amount of resources individual groups have varies. Capital cities also typically have many nonprofits. The Trenton, N.J., metro area is home to more locally focused nonprofits per capita than any metro area with a population exceeding 300,000. Madison, Wis., and Boulder, Colo., are not far behind. Among metros over 1 million, Boston registers the highest rate of locally focused nonprofits, followed by San Francisco and Washington, D.C.
To assess the concentration of nonprofits across the country, Governing reviewed 2018 IRS data published by the National Center for Charitable Statistics. Nonprofits with very narrow interests, such as college scholarship programs, or those dealing with national issues not specific to their communities, like medical research, were excluded.
What we found was that the concentration of locally focused nonprofits doesn’t just vary from one part of the country to another -- it varies a lot. The top 10 metro areas on our list have more than twice the number of nonprofits per capita as all those in the bottom quarter.
Consider Madison, Wis. The metro area has long ranked among the top in the country for its concentration of nonprofits, says Tom Linfield of the Madison Community Foundation. Along with the state capitol and the state’s flagship university, there’s a large park system and a cluster of lakes, both of which have numerous nonprofit groups advocating on their behalf. There’s even a virtuous circle of nonprofit activism, Linfield says, with the city’s rich history of foundations and charitable organizations spurring the creation of new grassroots groups focused on individual neighborhoods and specialized issues. “There are many people just full of passion who feel the need to do something,” he says, “but they don’t want to join [an existing organization]. They want to start their own thing.”
By comparison, fast-growth cities in the South and the West don’t have nearly as many nonprofits, at least on a per capita basis. The Las Vegas metro area, which has roughly doubled in population over the past two decades, has only about a quarter as many locally focused nonprofits as the top metros. The same is true in expanding communities in Florida, Texas and Utah.
In many older communities, especially those that are economically depressed, strong nonprofit sectors are helping beleaguered governments. A recent article in the journal Urban Affairs Review examined nonprofits in Midwestern cities that had endured significant public workforce cuts. In Flint, Mich., 82 percent of surveyed nonprofits reported providing additional services following the 2014 contaminated water emergency. Same with Detroit after its 2013 bankruptcy, when 56 percent of local nonprofits stepped up their services. The bottom line, says Sarah Reckhow of Michigan State University, one of the authors of the survey, is that “nonprofits are responsive and can be nimble in adding services when a crisis emerges.”
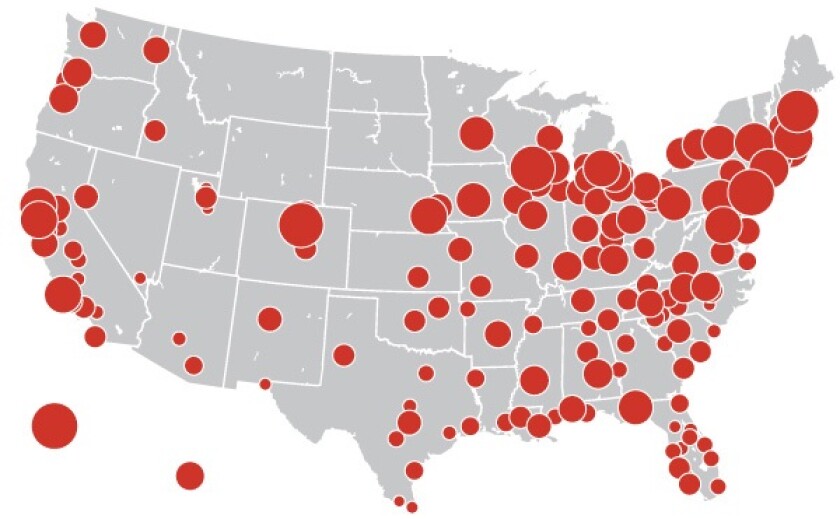
Larger icons represent more locally focused nonprofits per capita for metro areas.
Within individual metro areas, nonprofits are typically most active in disadvantaged neighborhoods. A 2015 Urban Institute analysis found that Census tracts with higher poverty rates had more community-oriented nonprofits per capita, with particularly high concentrations in the poorest places.
Whether residents actually seek out nonprofits depends on a number of factors. One of them, according to recent research, is their perception of local government. A study by American University researchers found that the more positively citizens felt about their government services, the more likely they were to use nonprofit services as well.
This all suggests that nonprofits and local governments rely on each other, rather than one sector acting to supplant the other.
Where Are All the Locally Focused Nonprofits?
| Metro Area | Nonprofits | Nonprofits Per 10k Population |
|---|---|---|
| Barnstable Town, MA | 517 | 24.2 |
| Pittsfield, MA | 286 | 22.6 |
| Santa Fe, NM | 285 | 19.0 |
| Missoula, MT | 219 | 18.4 |
| Ithaca, NY | 187 | 18.2 |
| Springfield, IL | 358 | 17.2 |
| Trenton, NJ | 634 | 17.1 |
| Bismarck, ND | 222 | 16.7 |
| Napa, CA | 231 | 16.6 |
| Madison, WI | 1,094 | 16.6 |
| Burlington-South Burlington, VT | 366 | 16.6 |
| Boulder, CO | 538 | 16.5 |
| Duluth, MN-WI | 447 | 16.0 |
| Great Falls, MT | 130 | 15.9 |
| Fairbanks, AK | 157 | 15.9 |
| Glens Falls, NY | 198 | 15.8 |
| Jefferson City, MO | 234 | 15.4 |
| Portland-South Portland, ME | 813 | 15.2 |
| Anchorage, AK | 595 | 14.9 |
| Bridgeport-Stamford-Norwalk, CT | 1,391 | 14.7 |
| Casper, WY | 115 | 14.5 |
| Charleston, WV | 301 | 14.3 |
| Corvallis, OR | 131 | 14.2 |
| Dubuque, IA | 137 | 14.1 |
| Boston-Cambridge-Newton, MA-NH | 6,895 | 14.1 |
| Albany-Schenectady-Troy, NY | 1,246 | 14.1 |
| Billings, MT | 242 | 14.1 |
| Santa Cruz-Watsonville, CA | 382 | 13.9 |
| Lincoln, NE | 465 | 13.9 |
| Kahului-Wailuku-Lahaina, HI | 231 | 13.8 |
| San Francisco-Oakland-Hayward, CA | 6,518 | 13.8 |
| Santa Maria-Santa Barbara, CA | 606 | 13.6 |
| Cheyenne, WY | 134 | 13.5 |
| Charlottesville, VA | 318 | 13.5 |
| Santa Rosa, CA | 673 | 13.5 |
| Midland, MI | 112 | 13.5 |
| Lima, OH | 138 | 13.4 |
| Watertown-Fort Drum, NY | 150 | 13.4 |
| Wheeling, WV-OH | 186 | 13.3 |
| San Luis Obispo-Paso Robles-Arroyo Grande, CA | 374 | 13.2 |
| Washington-Arlington-Alexandria, DC-VA-MD-WV | 8,230 | 13.2 |
| Harrisburg-Carlisle, PA | 754 | 13.1 |
| Lansing-East Lansing, MI | 632 | 13.1 |
| La Crosse-Onalaska, WI-MN | 179 | 13.1 |
| Hartford-West Hartford-East Hartford, CT | 1,576 | 13.1 |
| Johnstown, PA | 172 | 13.1 |
| Des Moines-West Des Moines, IA | 852 | 13.0 |
| Wenatchee, WA | 155 | 12.9 |
| Providence-Warwick, RI-MA | 2,085 | 12.9 |
| Rapid City, SD | 191 | 12.8 |
| Pittsburgh, PA | 2,982 | 12.8 |
| Rochester, MN | 281 | 12.8 |
| Ocean City, NJ | 118 | 12.7 |
| Sioux City, IA-NE-SD | 214 | 12.7 |
| New Haven-Milford, CT | 1,082 | 12.6 |
| Tallahassee, FL | 482 | 12.5 |
| Bloomsburg-Berwick, PA | 104 | 12.4 |
| Kingston, NY | 220 | 12.3 |
| Erie, PA | 334 | 12.3 |
| Syracuse, NY | 796 | 12.2 |
| Minneapolis-St. Paul-Bloomington, MN-WI | 4,432 | 12.2 |
| Grand Forks, ND-MN | 124 | 12.1 |
| Norwich-New London, CT | 318 | 11.9 |
| Carson City, NV | 66 | 11.9 |
| Topeka, KS | 275 | 11.8 |
| Altoona, PA | 144 | 11.8 |
| Manchester-Nashua, NH | 488 | 11.8 |
| Springfield, MA | 741 | 11.7 |
| Fargo, ND-MN | 287 | 11.7 |
| State College, PA | 190 | 11.7 |
| Bend-Redmond, OR | 224 | 11.7 |
| Bangor, ME | 176 | 11.6 |
| Mankato-North Mankato, MN | 118 | 11.6 |
| Ann Arbor, MI | 429 | 11.6 |
| Binghamton, NY | 274 | 11.4 |
| Sioux Falls, SD | 303 | 11.4 |
| Medford, OR | 250 | 11.4 |
| Grand Island, NE | 96 | 11.3 |
| Decatur, IL | 118 | 11.3 |
| Walla Walla, WA | 73 | 11.2 |
| Mount Vernon-Anacortes, WA | 144 | 11.2 |
| Parkersburg-Vienna, WV | 101 | 11.2 |
| Rochester, NY | 1,201 | 11.2 |
| Elmira, NY | 94 | 11.2 |
| Milwaukee-Waukesha-West Allis, WI | 1,758 | 11.2 |
| Lewiston-Auburn, ME | 120 | 11.1 |
| Buffalo-Cheektowaga-Niagara Falls, NY | 1,255 | 11.1 |
| Williamsport, PA | 126 | 11.1 |
| Bellingham, WA | 248 | 11.0 |
| Sheboygan, WI | 126 | 10.9 |
| Evansville, IN-KY | 343 | 10.9 |
| Terre Haute, IN | 184 | 10.8 |
| Redding, CA | 195 | 10.8 |
| St. Cloud, MN | 216 | 10.8 |
| Peoria, IL | 398 | 10.8 |
| Lexington-Fayette, KY | 555 | 10.7 |
| Harrisonburg, VA | 145 | 10.7 |
| Enid, OK | 65 | 10.7 |
| Iowa City, IA | 185 | 10.7 |
| Waterloo-Cedar Falls, IA | 181 | 10.7 |
| Portland-Vancouver-Hillsboro, OR-WA | 2,643 | 10.7 |
| Eugene, OR | 404 | 10.6 |
| Durham-Chapel Hill, NC | 612 | 10.6 |
| Morgantown, WV | 149 | 10.6 |
| Columbus, OH | 2,237 | 10.6 |
| Eau Claire, WI | 179 | 10.6 |
| Bloomington, IL | 200 | 10.6 |
| Davenport-Moline-Rock Island, IA-IL | 403 | 10.6 |
| Winston-Salem, NC | 708 | 10.5 |
| Oshkosh-Neenah, WI | 180 | 10.5 |
| Columbus, IN | 87 | 10.5 |
| Cumberland, MD-WV | 102 | 10.4 |
| Toledo, OH | 627 | 10.4 |
| Bay City, MI | 108 | 10.4 |
| Carbondale-Marion, IL | 129 | 10.4 |
| Wausau, WI | 140 | 10.3 |
| Columbia, MO | 186 | 10.3 |
| Ames, IA | 101 | 10.3 |
| Cleveland-Elyria, OH | 2,114 | 10.3 |
| Fond du Lac, WI | 105 | 10.2 |
| Montgomery, AL | 377 | 10.1 |
| Jackson, MS | 586 | 10.1 |
| Flagstaff, AZ | 144 | 10.1 |
| Asheville, NC | 461 | 10.0 |
| Seattle-Tacoma-Bellevue, WA | 3,926 | 10.0 |
| Bloomington, IN | 167 | 10.0 |
| Lancaster, PA | 539 | 9.9 |
| Cedar Rapids, IA | 270 | 9.9 |
| Utica-Rome, NY | 288 | 9.9 |
| Lawrence, KS | 120 | 9.9 |
| Philadelphia-Camden-Wilmington, PA-NJ-DE-MD | 6,009 | 9.9 |
| Chambersburg-Waynesboro, PA | 152 | 9.8 |
| Niles-Benton Harbor, MI | 151 | 9.8 |
| New York-Newark-Jersey City, NY-NJ-PA | 19,543 | 9.8 |
| Roanoke, VA | 307 | 9.8 |
| Dayton, OH | 788 | 9.8 |
| Midland, TX | 174 | 9.8 |
| Mansfield, OH | 118 | 9.7 |
| Battle Creek, MI | 131 | 9.7 |
| Albany, OR | 124 | 9.7 |
| Baltimore-Columbia-Towson, MD | 2,725 | 9.7 |
| Pine Bluff, AR | 87 | 9.7 |
| Worcester, MA-CT | 918 | 9.7 |
| Salisbury, MD-DE | 397 | 9.7 |
| Staunton-Waynesboro, VA | 119 | 9.7 |
| Sebastian-Vero Beach, FL | 152 | 9.7 |
| Urban Honolulu, HI | 946 | 9.7 |
| Abilene, TX | 165 | 9.6 |
| Morristown, TN | 114 | 9.6 |
| Salem, OR | 415 | 9.6 |
| Little Rock-North Little Rock-Conway, AR | 711 | 9.6 |
| Cape Girardeau, MO-IL | 93 | 9.6 |
| Fort Collins, CO | 336 | 9.6 |
| Hot Springs, AR | 95 | 9.6 |
| Saginaw, MI | 182 | 9.5 |
| Gettysburg, PA | 98 | 9.5 |
| Olympia-Tumwater, WA | 273 | 9.5 |
| Fort Wayne, IN | 417 | 9.5 |
| Kalamazoo-Portage, MI | 324 | 9.5 |
| Manhattan, KS | 93 | 9.5 |
| Sacramento--Roseville--Arden-Arcade, CA | 2,222 | 9.5 |
| Denver-Aurora-Lakewood, CO | 2,774 | 9.5 |
| Champaign-Urbana, IL | 226 | 9.4 |
| Mobile, AL | 390 | 9.4 |
| Youngstown-Warren-Boardman, OH-PA | 508 | 9.4 |
| South Bend-Mishawaka, IN-MI | 303 | 9.4 |
| Akron, OH | 661 | 9.4 |
| Salinas, CA | 408 | 9.4 |
| Michigan City-La Porte, IN | 103 | 9.4 |
| Omaha-Council Bluffs, NE-IA | 881 | 9.4 |
| Appleton, WI | 222 | 9.3 |
| Bremerton-Silverdale, WA | 251 | 9.3 |
| Scranton--Wilkes-Barre--Hazleton, PA | 516 | 9.3 |
| Monroe, LA | 164 | 9.3 |
| Indianapolis-Carmel-Anderson, IN | 1,900 | 9.3 |
| Spokane-Spokane Valley, WA | 528 | 9.2 |
| Green Bay, WI | 296 | 9.2 |
| Victoria, TX | 91 | 9.1 |
| Rockford, IL | 306 | 9.1 |
| Joplin, MO | 162 | 9.1 |
| St. Louis, MO-IL | 2,528 | 9.0 |
| Canton-Massillon, OH | 359 | 9.0 |
| Muncie, IN | 103 | 9.0 |
| San Jose-Sunnyvale-Santa Clara, CA | 1,791 | 9.0 |
| Pocatello, ID | 78 | 9.0 |
| Wichita Falls, TX | 135 | 8.9 |
| Allentown-Bethlehem-Easton, PA-NJ | 752 | 8.9 |
| Grand Rapids-Wyoming, MI | 954 | 8.9 |
| Blacksburg-Christiansburg-Radford, VA | 164 | 8.9 |
| New Orleans-Metairie, LA | 1,131 | 8.9 |
| Wilmington, NC | 262 | 8.9 |
| Lewiston, ID-WA | 56 | 8.9 |
| Richmond, VA | 1,143 | 8.8 |
| Grand Junction, CO | 134 | 8.7 |
| Chico, CA | 202 | 8.7 |
| Austin-Round Rock, TX | 1,888 | 8.7 |
| Springfield, OH | 117 | 8.7 |
| Gainesville, FL | 250 | 8.7 |
| Oxnard-Thousand Oaks-Ventura, CA | 738 | 8.7 |
| Atlantic City-Hammonton, NJ | 230 | 8.7 |
| Prescott, AZ | 201 | 8.7 |
| Macon-Bibb County, GA | 199 | 8.7 |
| Hagerstown-Martinsburg, MD-WV | 230 | 8.6 |
| Reading, PA | 360 | 8.6 |
| Kankakee, IL | 94 | 8.5 |
| San Angelo, TX | 102 | 8.5 |
| Chicago-Naperville-Elgin, IL-IN-WI | 8,089 | 8.5 |
| Kokomo, IN | 70 | 8.5 |
| Cincinnati, OH-KY-IN | 1,850 | 8.4 |
| Racine, WI | 166 | 8.4 |
| Nashville-Davidson--Murfreesboro--Franklin, TN | 1,629 | 8.4 |
| Hilton Head Island-Bluffton-Beaufort, SC | 183 | 8.4 |
| Kansas City, MO-KS | 1,799 | 8.4 |
| Rome, GA | 82 | 8.4 |
| Weirton-Steubenville, WV-OH | 98 | 8.4 |
| Farmington, NM | 104 | 8.3 |
| Lynchburg, VA | 219 | 8.3 |
| St. Joseph, MO-KS | 105 | 8.3 |
| Lebanon, PA | 117 | 8.3 |
| Albuquerque, NM | 756 | 8.3 |
| Reno, NV | 387 | 8.2 |
| Vineland-Bridgeton, NJ | 124 | 8.2 |
| Winchester, VA-WV | 114 | 8.2 |
| Raleigh, NC | 1,110 | 8.1 |
| Owensboro, KY | 97 | 8.1 |
| Columbia, SC | 678 | 8.1 |
| Athens-Clarke County, GA | 172 | 8.1 |
| Grants Pass, OR | 71 | 8.1 |
| Tyler, TX | 187 | 8.1 |
| Brunswick, GA | 96 | 8.1 |
| Janesville-Beloit, WI | 132 | 8.1 |
| Longview, WA | 88 | 8.1 |
| Jackson, MI | 128 | 8.1 |
| Louisville/Jefferson County, KY-IN | 1,045 | 8.1 |
| Waco, TX | 217 | 8.0 |
| Elkhart-Goshen, IN | 164 | 8.0 |
| Johnson City, TN | 161 | 7.9 |
| Pueblo, CO | 132 | 7.9 |
| York-Hanover, PA | 353 | 7.9 |
| Huntington-Ashland, WV-KY-OH | 277 | 7.9 |
| Lafayette-West Lafayette, IN | 174 | 7.8 |
| Birmingham-Hoover, AL | 902 | 7.8 |
| Danville, IL | 60 | 7.8 |
| San Diego-Carlsbad, CA | 2,564 | 7.7 |
| Baton Rouge, LA | 635 | 7.6 |
| Oklahoma City, OK | 1,066 | 7.6 |
| Amarillo, TX | 203 | 7.6 |
| Greensboro-High Point, NC | 585 | 7.6 |
| Boise City, ID | 556 | 7.6 |
| Naples-Immokalee-Marco Island, FL | 288 | 7.6 |
| Albany, GA | 116 | 7.6 |
| Coeur d'Alene, ID | 122 | 7.6 |
| North Port-Sarasota-Bradenton, FL | 620 | 7.5 |
| Twin Falls, ID | 83 | 7.5 |
| Gadsden, AL | 77 | 7.5 |
| Longview, TX | 164 | 7.5 |
| Chattanooga, TN-GA | 419 | 7.5 |
| Knoxville, TN | 655 | 7.4 |
| Idaho Falls, ID | 110 | 7.4 |
| Wichita, KS | 476 | 7.4 |
| Los Angeles-Long Beach-Anaheim, CA | 9,794 | 7.4 |
| Colorado Springs, CO | 543 | 7.3 |
| Lubbock, TX | 234 | 7.3 |
| Yakima, WA | 182 | 7.2 |
| Charleston-North Charleston, SC | 568 | 7.2 |
| Springfield, MO | 333 | 7.1 |
| Kingsport-Bristol-Bristol, TN-VA | 218 | 7.1 |
| Bowling Green, KY | 126 | 7.1 |
| Muskegon, MI | 123 | 7.1 |
| East Stroudsburg, PA | 120 | 7.1 |
| Tulsa, OK | 703 | 7.1 |
| Salt Lake City, UT | 864 | 7.1 |
| Savannah, GA | 275 | 7.1 |
| Detroit-Warren-Dearborn, MI | 3,044 | 7.0 |
| Shreveport-Bossier City, LA | 305 | 7.0 |
| Jackson, TN | 90 | 7.0 |
| Kennewick-Richland, WA | 204 | 6.9 |
| Florence, SC | 141 | 6.9 |
| Sherman-Denison, TX | 92 | 6.9 |
| Lake Charles, LA | 144 | 6.9 |
| Vallejo-Fairfield, CA | 305 | 6.8 |
| Memphis, TN-MS-AR | 922 | 6.8 |
| College Station-Bryan, TX | 178 | 6.8 |
| Sumter, SC | 72 | 6.8 |
| Atlanta-Sandy Springs-Roswell, GA | 3,991 | 6.7 |
| Sierra Vista-Douglas, AZ | 85 | 6.7 |
| Dothan, AL | 99 | 6.7 |
| Beaumont-Port Arthur, TX | 270 | 6.6 |
| Hattiesburg, MS | 98 | 6.6 |
| Fort Smith, AR-OK | 185 | 6.6 |
| Tucson, AZ | 678 | 6.5 |
| Anniston-Oxford-Jacksonville, AL | 74 | 6.5 |
| Flint, MI | 263 | 6.5 |
| Yuba City, CA | 113 | 6.5 |
| Greenville-Anderson-Mauldin, SC | 583 | 6.4 |
| Pensacola-Ferry Pass-Brent, FL | 318 | 6.4 |
| Corpus Christi, TX | 291 | 6.4 |
| Alexandria, LA | 98 | 6.4 |
| Greenville, NC | 114 | 6.3 |
| Lafayette, LA | 309 | 6.3 |
| Virginia Beach-Norfolk-Newport News, VA-NC | 1,081 | 6.3 |
| Jacksonville, FL | 958 | 6.2 |
| Rocky Mount, NC | 91 | 6.2 |
| Beckley, WV | 73 | 6.2 |
| Crestview-Fort Walton Beach-Destin, FL | 173 | 6.2 |
| Houma-Thibodaux, LA | 129 | 6.2 |
| Madera, CA | 97 | 6.2 |
| Fresno, CA | 610 | 6.1 |
| California-Lexington Park, MD | 69 | 6.1 |
| Monroe, MI | 92 | 6.1 |
| Hickory-Lenoir-Morganton, NC | 224 | 6.1 |
| Las Cruces, NM | 132 | 6.1 |
| Charlotte-Concord-Gastonia, NC-SC | 1,558 | 6.1 |
| Texarkana, TX-AR | 91 | 6.1 |
| Dover, DE | 108 | 6.0 |
| Huntsville, AL | 279 | 6.0 |
| Greeley, CO | 189 | 6.0 |
| Goldsboro, NC | 74 | 6.0 |
| Tuscaloosa, AL | 146 | 6.0 |
| Augusta-Richmond County, GA-SC | 361 | 6.0 |
| Visalia-Porterville, CA | 277 | 5.9 |
| New Bern, NC | 74 | 5.9 |
| Cleveland, TN | 73 | 5.9 |
| Florence-Muscle Shoals, AL | 86 | 5.8 |
| Homosassa Springs, FL | 86 | 5.8 |
| Jonesboro, AR | 77 | 5.8 |
| Daphne-Fairhope-Foley, AL | 125 | 5.7 |
| Tampa-St. Petersburg-Clearwater, FL | 1,795 | 5.7 |
| Dallas-Fort Worth-Arlington, TX | 4,281 | 5.7 |
| Panama City, FL | 114 | 5.7 |
| Cape Coral-Fort Myers, FL | 427 | 5.7 |
| Burlington, NC | 94 | 5.6 |
| Columbus, GA-AL | 171 | 5.6 |
| Fayetteville-Springdale-Rogers, AR-MO | 307 | 5.6 |
| Gainesville, GA | 113 | 5.6 |
| Modesto, CA | 305 | 5.5 |
| Gulfport-Biloxi-Pascagoula, MS | 220 | 5.5 |
| Decatur, AL | 84 | 5.5 |
| Punta Gorda, FL | 102 | 5.5 |
| Spartanburg, SC | 188 | 5.5 |
| Sebring, FL | 58 | 5.5 |
| Miami-Fort Lauderdale-West Palm Beach, FL | 3,407 | 5.5 |
| Hanford-Corcoran, CA | 83 | 5.5 |
| Elizabethtown-Fort Knox, KY | 84 | 5.5 |
| Valdosta, GA | 80 | 5.5 |
| Stockton-Lodi, CA | 411 | 5.5 |
| Logan, UT-ID | 76 | 5.4 |
| Port St. Lucie, FL | 260 | 5.4 |
| Dalton, GA | 77 | 5.3 |
| Palm Bay-Melbourne-Titusville, FL | 315 | 5.3 |
| Auburn-Opelika, AL | 85 | 5.2 |
| Orlando-Kissimmee-Sanford, FL | 1,326 | 5.2 |
| San Antonio-New Braunfels, TX | 1,273 | 5.1 |
| Houston-The Woodlands-Sugar Land, TX | 3,515 | 5.0 |
| Odessa, TX | 81 | 5.0 |
| Deltona-Daytona Beach-Ormond Beach, FL | 329 | 5.0 |
| Bakersfield, CA | 445 | 5.0 |
| Hammond, LA | 66 | 4.9 |
| Phoenix-Mesa-Scottsdale, AZ | 2,384 | 4.9 |
| El Centro, CA | 89 | 4.9 |
| Myrtle Beach-Conway-North Myrtle Beach, SC-NC | 223 | 4.6 |
| Lakeland-Winter Haven, FL | 328 | 4.6 |
| Killeen-Temple, TX | 207 | 4.6 |
| Clarksville, TN-KY | 133 | 4.6 |
| Merced, CA | 122 | 4.4 |
| Warner Robins, GA | 85 | 4.4 |
| St. George, UT | 74 | 4.3 |
| Riverside-San Bernardino-Ontario, CA | 1,941 | 4.2 |
| Ogden-Clearfield, UT | 269 | 4.0 |
| Lake Havasu City-Kingman, AZ | 83 | 4.0 |
| Yuma, AZ | 81 | 3.8 |
| Ocala, FL | 137 | 3.8 |
| Lawton, OK | 48 | 3.8 |
| Fayetteville, NC | 143 | 3.7 |
| Provo-Orem, UT | 209 | 3.3 |
| Brownsville-Harlingen, TX | 138 | 3.3 |
| Hinesville, GA | 26 | 3.2 |
| El Paso, TX | 271 | 3.2 |
| Las Vegas-Henderson-Paradise, NV | 705 | 3.2 |
| Jacksonville, NC | 62 | 3.1 |
| Laredo, TX | 80 | 2.9 |
| The Villages, FL | 34 | 2.6 |
| McAllen-Edinburg-Mission, TX | 204 | 2.4 |
