

Last week, the U.S. Department of Labor published new state-level 2015 annual employment data for different demographic groups.
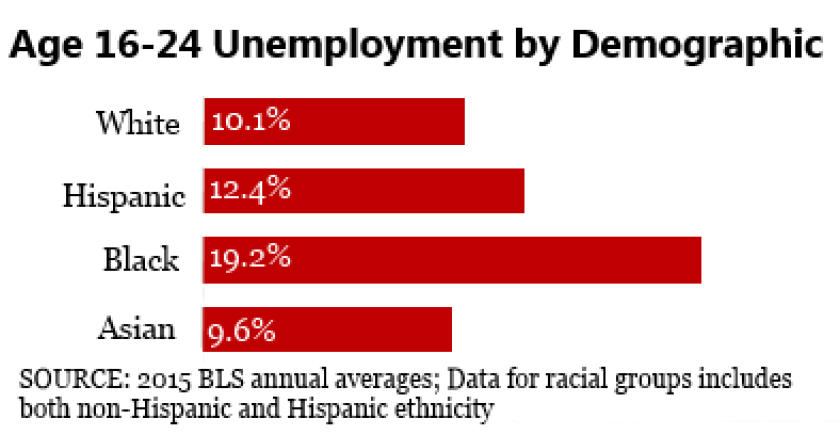
The national unemployment rate for people age 16 to 24 now stands at 10.5 percent. That’s well below the nearly 20 percent rate reached in 2010, but it still far exceeds the 4.9 percent national rate for all workers. Other measures taking into account younger workers not currently in the labor market show they have a much longer way to go for a full recovery.
States registering the highest youth unemployment rates for 2015 were West Virginia (17.4 percent), South Carolina (16.2 percent) and Georgia (14.6 percent). States posting the lowest rates included North Dakota (4.5 percent), Nebraska (6.5 percent), New Hampshire (7 percent) and Utah (7 percent).
| State | Age 16-24 Rate | Age 25-54 Rate | Total Rate |
|---|---|---|---|
| Alabama | 13.3% | 5.5% | 6.1% |
| Alaska | 12.3% | 5.7% | 6.7% |
| Arizona | 12.4% | 5.0% | 6.0% |
| Arkansas | 11.1% | 5.0% | 5.2% |
| California | 13.3% | 5.2% | 6.2% |
| Colorado | 8.3% | 3.5% | 3.9% |
| Connecticut | 10.0% | 5.6% | 5.6% |
| Delaware | 12.0% | 4.6% | 5.0% |
| District of Columbia | 14.6% | 6.0% | 6.9% |
| Florida | 11.1% | 4.8% | 5.4% |
| Georgia | 14.6% | 4.5% | 5.8% |
| Hawaii | 8.7% | 3.6% | 3.7% |
| Idaho | 8.2% | 3.5% | 4.3% |
| Illinois | 13.1% | 4.9% | 5.9% |
| Indiana | 11.5% | 4.1% | 4.8% |
| Iowa | 8.4% | 2.9% | 3.6% |
| Kansas | 7.5% | 3.9% | 4.3% |
| Kentucky | 13.3% | 4.3% | 5.4% |
| Louisiana | 13.6% | 5.4% | 6.2% |
| Maine | 10.6% | 4.0% | 4.4% |
| Maryland | 12.2% | 4.6% | 5.2% |
| Massachusetts | 10.0% | 4.4% | 4.9% |
| Michigan | 11.9% | 4.5% | 5.4% |
| Minnesota | 7.7% | 3.5% | 3.8% |
| Mississippi | 14.5% | 5.4% | 6.5% |
| Missouri | 10.7% | 4.3% | 5.0% |
| Montana | 7.2% | 3.9% | 4.1% |
| Nebraska | 6.5% | 2.3% | 3.0% |
| Nevada | 13.5% | 6.0% | 6.9% |
| New Hampshire | 7.0% | 2.7% | 3.4% |
| New Jersey | 11.9% | 4.9% | 5.8% |
| New Mexico | 14.1% | 6.3% | 6.8% |
| New York | 14.2% | 4.0% | 5.3% |
| North Carolina | 14.3% | 5.0% | 5.9% |
| North Dakota | 4.5% | 2.7% | 2.7% |
| Ohio | 12.5% | 3.7% | 4.9% |
| Oklahoma | 9.0% | 3.8% | 4.3% |
| Oregon | 12.7% | 4.2% | 5.7% |
| Pennsylvania | 10.1% | 4.6% | 5.2% |
| Rhode Island | 10.7% | 5.2% | 5.9% |
| South Carolina | 16.2% | 4.7% | 5.9% |
| South Dakota | 9.6% | 2.6% | 3.5% |
| Tennessee | 12.6% | 4.8% | 5.7% |
| Texas | 9.3% | 3.7% | 4.4% |
| Utah | 7.0% | 2.7% | 3.6% |
| Vermont | 9.4% | 3.0% | 3.6% |
| Virginia | 9.9% | 4.0% | 4.5% |
| Washington | 11.7% | 4.9% | 5.6% |
| West Virginia | 17.4% | 6.0% | 6.9% |
| Wisconsin | 9.3% | 4.1% | 4.6% |
| Wyoming | 8.9% | 3.2% | 4.1% |
In general, unemployment for younger workers mirrors that of the rest of the workforce; states with lower youth unemployment rates tend to have lower rates overall. But a few states report particularly high youth unemployment despite average or below-average rates for other workers. In New York, for example, prime working age (25 to 54) employees recorded an unemployment rate of 4 percent, while youth unemployment was 14.2 percent -- one of the highest rates nationally. Other states with larger disparities included Kentucky (13.3 percent youth unemployment vs. 4.3 percent prime-working age unemployment) and Ohio (12.5 percent youth unemployment vs. 3.7 percent prime-working age unemployment).
Industries more inclined to hire young workers, like hospitality or tourism, have performed better in some states.
Youth unemployment can also be assessed via state employment-to-population ratios. This broader measure considers those not in the labor force, including individuals who’ve given up their job search and full-time college students. Mississippi, New Jersey and New York recorded the lowest average youth employment-to-population ratios last year.
| State | Age 16-24 Ratio | Age 16-19 Ratio | Age 20-24 Ratio |
|---|---|---|---|
| Alabama | 44.6% | 25.3% | 59.9% |
| Alaska | 52.7% | 33.2% | 66.9% |
| Arizona | 48.8% | 29.9% | 64.3% |
| Arkansas | 46.4% | 26.4% | 63.4% |
| California | 43.3% | 22.2% | 58.2% |
| Colorado | 53.4% | 28.8% | 72.0% |
| Connecticut | 44.7% | 21.5% | 65.9% |
| Delaware | 49.4% | 30.7% | 63.6% |
| District of Columbia | 46.0% | 13.6% | 59.8% |
| Florida | 44.6% | 24.2% | 61.8% |
| Georgia | 43.1% | 21.5% | 59.2% |
| Hawaii | 46.3% | 27.3% | 61.4% |
| Idaho | 55.7% | 39.7% | 68.6% |
| Illinois | 49.5% | 31.1% | 63.6% |
| Indiana | 50.9% | 32.1% | 66.4% |
| Iowa | 64.3% | 50.6% | 74.1% |
| Kansas | 59.2% | 42.1% | 72.6% |
| Kentucky | 48.0% | 27.6% | 62.5% |
| Louisiana | 46.6% | 27.7% | 59.8% |
| Maine | 53.3% | 36.8% | 66.8% |
| Maryland | 51.0% | 29.8% | 67.2% |
| Massachusetts | 50.7% | 29.3% | 64.2% |
| Michigan | 52.6% | 34.8% | 65.4% |
| Minnesota | 60.0% | 45.8% | 71.5% |
| Mississippi | 42.0% | 20.9% | 57.0% |
| Missouri | 58.2% | 40.0% | 73.8% |
| Montana | 57.7% | 42.1% | 68.8% |
| Nebraska | 61.9% | 42.9% | 74.4% |
| Nevada | 52.1% | 30.7% | 69.4% |
| New Hampshire | 63.0% | 44.8% | 77.7% |
| New Jersey | 41.5% | 21.9% | 57.8% |
| New Mexico | 44.0% | 23.7% | 60.2% |
| New York | 41.4% | 21.8% | 55.4% |
| North Carolina | 45.1% | 24.2% | 60.6% |
| North Dakota | 65.3% | 44.0% | 78.6% |
| Ohio | 52.4% | 34.5% | 67.8% |
| Oklahoma | 52.0% | 30.1% | 68.4% |
| Oregon | 47.4% | 26.1% | 65.9% |
| Pennsylvania | 53.7% | 35.3% | 66.6% |
| Rhode Island | 55.6% | 34.6% | 70.2% |
| South Carolina | 44.7% | 23.1% | 62.2% |
| South Dakota | 61.2% | 46.0% | 72.2% |
| Tennessee | 52.4% | 30.8% | 67.9% |
| Texas | 48.4% | 26.2% | 64.8% |
| Utah | 63.1% | 44.7% | 76.0% |
| Vermont | 55.4% | 40.8% | 67.9% |
| Virginia | 49.0% | 27.8% | 65.9% |
| Washington | 49.9% | 26.2% | 70.8% |
| West Virginia | 45.0% | 20.4% | 60.8% |
| Wisconsin | 61.4% | 44.2% | 74.0% |
| Wyoming | 59.5% | 39.1% | 73.4% |
SOURCE: 2015 annual average (preliminary) data published by U.S. Bureau of Labor Statistics
Part of President Obama’s recent budget proposal includes nearly $6 billion in new funding for youth employment. One major component of the plan is a $3.5 billion investment in partnerships with companies and localities to provide summer jobs and up to a year of paid work for those out of school. Another $2 billion would fund a competitive grant program aimed at putting youth who’ve dropped out of high school or are most at risk of doing so on a pathway to earning a diploma.


